


Signal Flow Graph
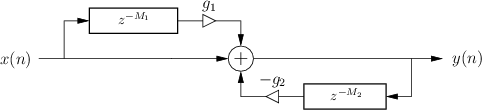
Figure 3.1 shows the signal flow graph (or system
diagram) for the class of digital filters we are considering (digital
comb filters). The symbol ``![]() '' means a delay of
'' means a delay of ![]() samples (always an integer here). This notation for a pure delay will
make more sense after we derive the filter transfer function in
§3.7.
samples (always an integer here). This notation for a pure delay will
make more sense after we derive the filter transfer function in
§3.7.
 |
Next Section:
Software Implementation in Matlab
Previous Section:
Difference Equation


