Plotting Complex Sinusoids versus Frequency
As discussed in the previous section, we regard the signal
as a
positive-frequency sinusoid when

. In a
manner analogous to spectral magnitude plots (discussed in
§
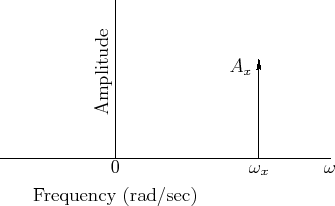
4.1.6), we can plot this
complex sinusoid over a frequency
axis as a vertical line of length

at the point

, as shown in Fig.
4.10. Such a plot of
amplitude versus frequency may be called a
spectral plot, or
spectral representation [
44] of the (
zero-phase)
complex sinusoid.
figure[htbp]
 More generally, however, a complex sinusoid has both an amplitude and
a phase (or, equivalently, a complex amplitude):
More generally, however, a complex sinusoid has both an amplitude and
a phase (or, equivalently, a complex amplitude):
To accommodate the phase angle

in spectral plots, the
plotted vector may be rotated by the angle
in the plane
orthogonal to the frequency axis passing through

, as done
in Fig.
4.16b below (p.
![[*]](../icons/crossref.png)
)
for phase angles

.
Next Section: Sinusoidal Amplitude Modulation (AM)Previous Section: Positive and Negative Frequencies


