


Sinusoid Magnitude Spectra
A sinusoid's frequency content may be graphed in the frequency domain as shown in Fig.4.6.
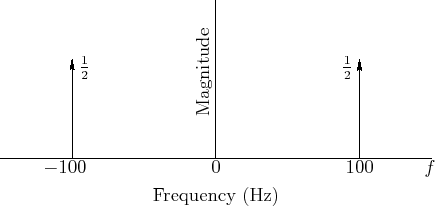
An example of a particular sinusoid graphed in Fig.4.6 is given by
Figure 4.6 can be viewed as a graph of the magnitude
spectrum of ![]() , or its spectral magnitude representation
[44]. Note that the spectrum consists of two components
with amplitude
, or its spectral magnitude representation
[44]. Note that the spectrum consists of two components
with amplitude ![]() , one at frequency
, one at frequency ![]() Hz and the other at
frequency
Hz and the other at
frequency ![]() Hz.
Hz.
Phase is not shown in Fig.4.6 at all. The phase of the components could be written simply as labels next to the magnitude arrows, or the magnitude arrows can be rotated ``into or out of the page'' by the appropriate phase angle, as illustrated in Fig.4.16.
Next Section:
Why Exponentials are Important
Previous Section:
Constructive and Destructive Interference


