Specific DB Scales
Since we so often rescale our signals to suit various needs (avoiding
overflow, reducing quantization noise, making a nicer plot, etc.),
there seems to be little point in worrying about what the dB reference
is--we simply choose it implicitly when we rescale to obtain signal
values in the range we want to see. In particular, dB relative
to full scale (
![]() ), abbreviated
dBFS, is perhaps the most commonly used case in the digital
audio world. Thus, 0 dBFS means maximum amplitude, and typical
amplitude levels are negative in dBFS. In addition, there are a few
specific dB scales that are worth knowing about.
), abbreviated
dBFS, is perhaps the most commonly used case in the digital
audio world. Thus, 0 dBFS means maximum amplitude, and typical
amplitude levels are negative in dBFS. In addition, there are a few
specific dB scales that are worth knowing about.
DBm Scale
One common dB scale in audio recording is the dBm scale in which the reference power is taken to be a milliwatt (1 mW) dissipated by a 600 Ohm resistor. (See §F.3 for a primer on resistors, voltage, current, and power.)
DBV Scale
Another dB scale is the dBV scale which sets 0 dBV to 1 volt. Thus, a 100-volt signal is
 40 dBV
 60 dBV
DB SPL
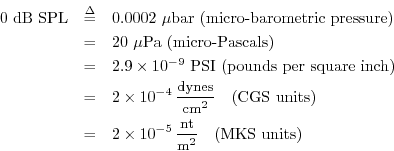
Sound Pressure Level (SPL) is defined using a reference which is approximately the intensity of 1000 Hz sinusoid that is just barely audible (zero ``phons''). In pressure units:F.3

In intensity units:
Since sound is created by a time-varying pressure, we compute sound levels in dB-SPL by using the average intensity (averaged over at least one period of the lowest frequency contained in the sound).
Table F.1 gives a list of common sound levels and their dB
equivalents [54]:
|
In my experience, the ``threshold of pain'' is most often defined as 120 dB.
The relationship between sound amplitude and actual loudness is complex [76]. Loudness is a perceptual dimension while sound amplitude is physical. Since loudness sensitivity is closer to logarithmic than linear in amplitude (especially at moderate to high loudnesses), we typically use decibels to represent sound amplitude, especially in spectral displays.
The sone amplitude scale is defined in terms of actual loudness perception experiments [76]. At 1kHz and above, loudness perception is approximately logarithmic above 50 dB SPL or so. Below that, it tends toward being more linear.
The phon amplitude scale is simply the dB scale at 1kHz [76, p. 111]. At other frequencies, the amplitude in phons is defined by following the equal-loudness curve over to 1 kHz and reading off the level there in dB SPL. In other words, all pure tones have the same loudness at the same phon level, and 1 kHz is used to set the reference in dB SPL. Just remember that one phon is one dB-SPL at 1 kHz. Looking at the Fletcher-Munson equal-loudness curves [76, p. 124], loudness in phons can be read off along the vertical line at 1 kHz.
Classically, the intensity level of a sound wave is its dB SPL
level, measuring the peak time-domain pressure-wave amplitude relative to
![]() watts per centimeter squared (i.e., there is no consideration of
the frequency domain here at all).
watts per centimeter squared (i.e., there is no consideration of
the frequency domain here at all).
Another classical term still encountered is the sensation level of pure tones: The sensation level is the number of dB SPL above the hearing threshold at that frequency [76, p. 110].
For further information on ``doing it right,'' see, for example,
http://www.measure.demon.co.uk/Acoustics_Software/loudness.html.
DBA (A-Weighted DB)
The so-called A-weighted dB scale (abbreviated dBA) is based on the Fletcher-Munson equal-loudness curve for an SPL of 40 phons.F.4 Thus, a dBA weighting assumes a fairly quiet pure tone. Despite this assumption, the dBA weighting is often used as an approximate equal loudness adjustment for measured spectra.
An analog filter transfer function that can be used to implement an approximate A-weighting is given byF.5

The ITU-R 468 noise weightingF.6is said to perform better for measuring noise in audio systems.
DB for Display
In practical signal processing, it is common to choose the maximum signal magnitude as the reference amplitude. That is, we normalize the signal so that the maximum amplitude is defined as 1, or 0 dB. This convention is also used by ``sound level meters'' in audio recording. When displaying magnitude spectra, the highest spectral peak is often normalized to 0 dB. We can then easily read off lower peaks as so many dB below the highest peak.
Figure F.1b shows a plot of the Fast Fourier Transform (FFT) of
ten periods of a ``Kaiser-windowed'' sinusoid at ![]() Hz. (FFT
windows are introduced in §8.1.4.
The window is used to
taper a finite-duration section of the signal.) Note that the peak dB
magnitude has been normalized to zero, and that the plot has been
clipped at -100 dB.
Hz. (FFT
windows are introduced in §8.1.4.
The window is used to
taper a finite-duration section of the signal.) Note that the peak dB
magnitude has been normalized to zero, and that the plot has been
clipped at -100 dB.
Below is the Matlab code for producing Fig.F.1. Note that it contains several elements (windows, zero padding, spectral interpolation) that we will not cover until later. They are included here as ``forward references'' in order to keep the example realistic and practical, and to give you an idea of ``how far we have to go'' before we know how to do practical spectrum analysis. Otherwise, the example just illustrates plotting spectra on an arbitrary dB scale between convenient limits.
% Practical display of the fft of a synthesized sinusoid

fs = 44100;             % Sampling rate
f = 440;                % Sinusoidal frequency = A-440
nper = 10;              % Number of periods to synthesize
dur = nper/f;           % Duration in seconds
T = 1/fs;               % Sampling period
t = 0:T:dur;            % Discrete-time axis in seconds
L = length(t)           % Number of samples to synthesize
ZP = 5;                 % Zero padding factor
N = 2^(nextpow2(L*ZP))  % FFT size (power of 2)

x = cos(2*pi*f*t);      % A sinusoid at A-440 ("row vector")
w = kaiser(L,8);        % An "FFT window"
xw = x .* w';           % Need to transpose w to get a row
sound(xw,fs);           % Might as well listen to it
xzp = [xw,zeros(1,N-L)];% Zero-padded FFT input buffer
X = fft(xzp);           % Interpolated spectrum of xw

Xmag = abs(X);          % Spectral magnitude
Xdb = 20*log10(Xmag);   % Spectral magnitude in dB

XdbMax = max(Xdb);      % Peak dB magnitude
Xdbn = Xdb - XdbMax;    % Normalize to 0dB peak

dBmin = -100;           % Don't show anything lower than this
Xdbp = max(Xdbn,dBmin); % Normalized, clipped, dB mag spec
fmaxp = 2*f;            % Upper frequency limit of plot, Hz
kmaxp = fmaxp*N/fs;     % Upper frequency limit of plot, bins
fp = fs*[0:kmaxp]/N;    % Frequency axis in Hz

% Ok, plot it already!

subplot(2,1,1);
plot(1000*t,xw);
xlabel('Time (ms)');
ylabel('Amplitude');
title(sprintf(['a) %d Periods of a %3.0f Hz Sinusoid, ',
               'Kaiser Windowed'],nper,f)R);

subplot(2,1,2);
plot(fp,Xdbp(1:kmaxp+1)); grid;
% Plot a dashed line where the peak should be:
  hold on; plot([440 440],[dBmin,0],'--'); hold off;
xlabel('Frequency (Hz)');
ylabel('Magnitude (dB)');
title(sprintf(['b) Interpolated FFT of %d Periods of ',...
        '%3.0f Hz Sinusoid'],nper,f));
The following more compact Matlab produces essentially the same plot, but without the nice physical units on the horizontal axes:
x = cos([0:2*pi/20:10*2*pi]); % 10 periods, 20 samples/cycle
L = length(x);
xw = x' .* kaiser(L,8);
N = 2^nextpow2(L*5);
X = fft([xw',zeros(1,N-L)]);

subplot(2,1,1); plot(xw);
xlabel('Time (samples)'); ylabel('Amplitude');
title('a) 10 Periods of a Kaiser-Windowed Sinusoid');

subplot(2,1,2); kmaxp = 2*10*5; Xl = 20*log10(abs(X(1:kmaxp+1)));
plot([10*5+1,10*5+1],[-100,0],[0:kmaxp],max(Xl-max(Xl),-100)); grid;
xlabel('Frequency (Bins)'); ylabel('Magnitude (dB)');
title('b) Interpolated FFT of 10 Periods of Sinusoid');
Next Section:
Dynamic Range
Previous Section:
Properties of DB Scales


![\includegraphics[width=\twidth]{eps/freqdpy}](http://www.dsprelated.com/josimages_new/mdft/img1954.png)


