


Approximate Maximum Likelihood F0 Estimation
In applications for which the fundamental frequency F0 must be
measured very accurately in a periodic signal,
the estimate
![]() obtained by the above
algorithm can be refined using a gradient search which matches a
so-called ``harmonic comb'' to the magnitude spectrum of an
interpolated FFT
obtained by the above
algorithm can be refined using a gradient search which matches a
so-called ``harmonic comb'' to the magnitude spectrum of an
interpolated FFT ![]() :
:
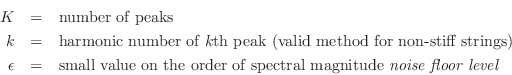
![$\displaystyle {\hat f}_0 \isdefs \arg\max_{{\hat f}_0} \sum_{k=1}^K \log\left[\...
...f}_0} \prod_{k=1}^K \left[\left\vert X(k{\hat f}_0)\right\vert+\epsilon\right]
$](http://www.dsprelated.com/josimages_new/pasp/img1471.png)
Note that freely vibrating strings are not exactly periodic due to
exponenential decay, coupling effects, and stiffness (which stretches
harmonics into quasiharmonic overtones, as explained
in §6.9). However, non-stiff strings can often be
analyzed as having approximately harmonic spectra (
![]() periodic time waveform) over a limited time frame.
periodic time waveform) over a limited time frame.
Since string spectra typically exhibit harmonically spaced
nulls associated
with the excitation and/or observation points, as well as from other
phenomena such as recording multipath and/or reverberation, it is
advisable to restrict ![]() to a range that does not include any
spectral nulls (or simply omit index
to a range that does not include any
spectral nulls (or simply omit index ![]() when
when
![]() is
too close to a spectral null),
since even one spectral null can push the product of
peak amplitudes to a very small value. As a practical matter, it is
important to inspect the magnitude spectra of the data manually to
ensure that a robust row of peaks is being matched by the harmonic
comb. For example, a display of the frame magnitude spectrum overlaid
with vertical lines at the optimized harmonic-comb frequencies yields
an effective picture of the F0 estimate in which typical problems
(such as octave errors) are readily seen.
is
too close to a spectral null),
since even one spectral null can push the product of
peak amplitudes to a very small value. As a practical matter, it is
important to inspect the magnitude spectra of the data manually to
ensure that a robust row of peaks is being matched by the harmonic
comb. For example, a display of the frame magnitude spectrum overlaid
with vertical lines at the optimized harmonic-comb frequencies yields
an effective picture of the F0 estimate in which typical problems
(such as octave errors) are readily seen.
Next Section:
References on F0 Estimation
Previous Section:
Summary


