Discrete Wavelet Transform Filter Bank Implementation (part 1)
UPDATE: Added graphs and code to explain the frequency division of the branches
The focus of this article is to briefly explain an implementation of this transform and several filter bank forms. Theoretical information about DWT can be found elsewhere.
First of all, a 'quick and dirty' simplified explanation of the differences between DFT and DWT:
The DWT (Discrete Wavelet Transform), simply put, is an operation that receives a signal as an input (a vector of data) and decomposes it in its frequential components. By this description, it may be confused with the also very important DFT (Discrete Fourier Transform) but the DWT has its tricks.
First, DFT has a fixed frequency resolution (eg: It can separate frequential components lineally along the whole frequency range), on the other hand, DWT can separate frequential components with an increasing frequency resolution as the frequency increases. This means that at bigger frequencies, the number of components that can be distinguished is larger.
So, in many cases it would be prefered to have a more fine resolution for a better analysis of the signal.
Basic description of a DWT
Having a data vector as an input, it has several outputs, each one describing a "main" component and a "detail" component. To achieve this, a digital filter must be used. There are 2 kinds of filters for this transform: high-pass and low-pass. The most basic form of this transform is to use just one of each kind to transform the signal.

(picture taken from Wikipedia)
As you can see, the signal is first filtered by a "g" low-pass filter, and simultaneously by a "h" high-pass filter. This divides the flow into 2 branches, that are downsampled by base 2. The "filter" operations are matematically a convolution between the input and the filter:
y1[m] = downsample{conv{x[n],g[n]},2}
and,
y2[m] = downsample{conv{x[n],g[n]},2}
Cascading
And this process can be cascaded, to get the higher frequency resolution we talked about previously. This process generates a filter bank.

(picture taken from Wikipedia)
As one goes deeper on the level of the branches, one gets higher resolution coefficients. Also, as one can see, a low-pass filter is downsampled and then convoluted with a high-pass filter, this means that the results are then filtered to get the high and the low part again, furthermore dividing the components even more. Each of the flow-paths is what we can call "branches".
Frequency Division
Before continuing, please get the code from: http://www.dsprelated.com/showcode/13.php
You'll also need this: http://www.dsprelated.com/showcode/10.php
... and this: http://www.dsprelated.com/showcode/12.php
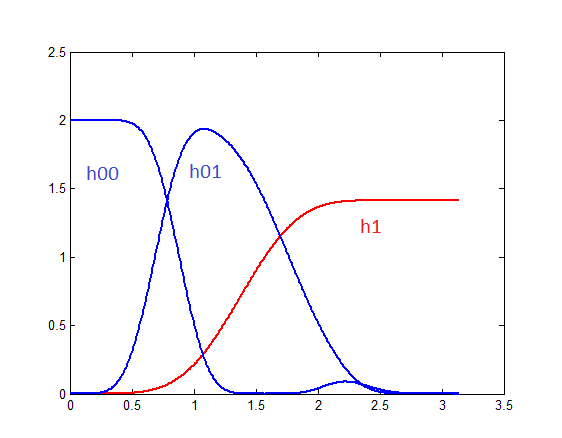
Now, in the normal DWT, the only part that gets cascaded is the low-pass part, so in a 2-stage DWT you will have a single high-pass branch (named h1), and the first low-pass branch is again divided into a "lower" low-pass branch (that I call h00) and a "higher" low-pass branch (named h01).
The following graph shows what the spectrum for these branches look like:

But if you go to the code, in the following lines:
L = length(h0); %Base filter lenght
n_stages = 2; %Of the low-pass stage
n_branches = 2^n_stages; %Number of branches
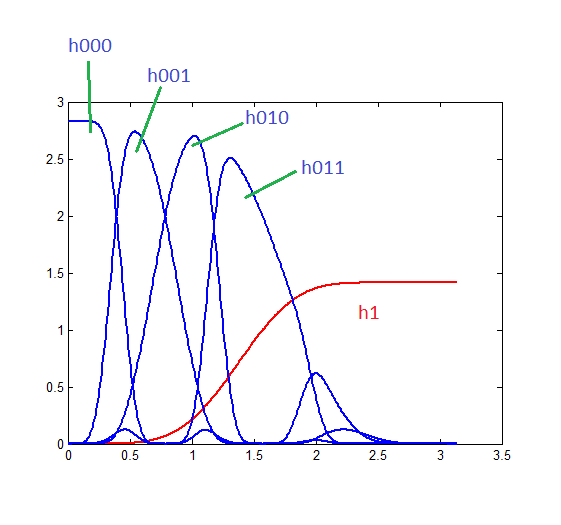
Change n_stages to 3 to get the filters of a 3-stage DWT, and the graph should look like this:

This means that while the high-pass branch is left unaltered, the low-pass tree gets 4 separate branches now, with narrower frequency ranges. This is how the frequency resolution gets increased. For the low pass filters, the first number from left to right indicates that their "father" is the first low-pass branch, the next number indicates what was the next branch they are from and the last number is the last branch (low or high-pass) they are formed by.
There is a similar form of the DWT, called DWPT (Discrete Wavelet Packet Transform) which is mostly used for image processing, and also cascades the high-pass branch, but we'll talk about it another time.
Equivalent blocks
By now, if you are curious, you've seen in the code of the function called formfilters()
What it does? First of all, normally one should go through the filter (convolutions) and downsampling blocks one by one, that is much more time consuming and most of that time gets wasted because of the downsampling: You'll compute values that will simply be trashed.
But then a mathematical trick comes in hand. ¿Remember that downsampling blocks? These and the filter blocks can be analized with the Z transform (but we won't discuss about it right now). The thing is, that one can build a single equivalent block that works exactly the same as the filter and the downsampling in a single convolution operation. ¿How? First of all, the signal resulting from the convolution between the input and one of the filters, gets immediately downsampled, so, in the end we only use half of the results we originally calculated. This allows us to just compute the values that are really neccesary.
The equivalent block is called "equivalent filter" and to get it one must convolute one filter against the another, but one of them must be previously upsampled (base 2). The combination of filters (and upsampled filter) depends on which branch of the filter bank we are, as a combination of high-pass with an upsampled low-pass filter can get us a filter that first gets the high-frequency part, and then gets the lower-frequency part of the one it just got.
Yes, we can build these equivalent filters by hand, but things get a bit tedious when dealing with longer filters, many cascading levels (which mean more branches) and more downsampling stages.
In the next post, we'll talk about an automated method to build these filters -that is what formfilters() does-, how to use these filters and the different filter bank layouts, with their respective applications.
UPDATE: Next blog post at http://www.dsprelated.com/showarticle/126.php
Stay tuned!
- David
- Comments
- Write a Comment Select to add a comment
Hi,
Is there any article that explains the content of wavelet co-efficients?
FFT gives frequency compenents and its amplitudes .
Not to sure ho w to interpret Freq, Amplitude and time related aspects from wavelets? What exactly does co-efficients 0mean? My requirement is from a signals get DWT co-efficients (10 point - 2 power 10 frequencies?) , calcualte average power in each level (10 levels) . I get 10 x 1 matrix. This matrix I need to use as feature vector for my Machine learing classification. I feel I am missign something as I am novice to wavelets. Is there any white paper that explains the content of wavelet co-effcients in an intutive way?
To post reply to a comment, click on the 'reply' button attached to each comment. To post a new comment (not a reply to a comment) check out the 'Write a Comment' tab at the top of the comments.
Please login (on the right) if you already have an account on this platform.
Otherwise, please use this form to register (free) an join one of the largest online community for Electrical/Embedded/DSP/FPGA/ML engineers:


