DSPRelated.com
Blogs

Python scipy.signal IIR Filter Design Cont.

Christopher FeltonJune 19, 20127 comments

In the previous post the Python scipy.signal iirdesign function was disected.  We reviewed the basics of filter specification and reviewed how to use the iirdesign function to design IIR filters.  The previous post I only demonstrated low pass filter designs.  The following are examples how to use the iirdesign function for highpass, bandpass, and stopband filters designs.
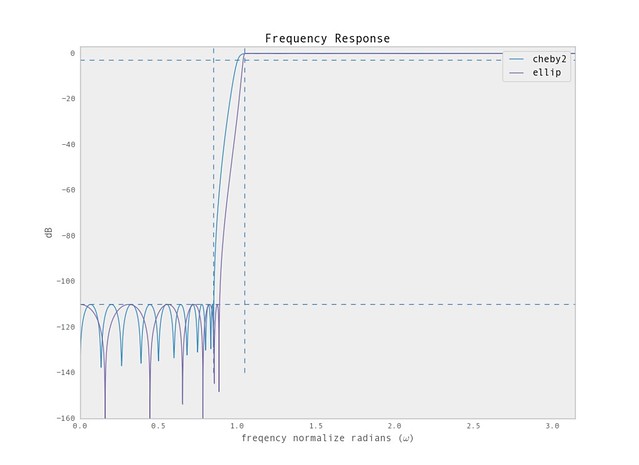
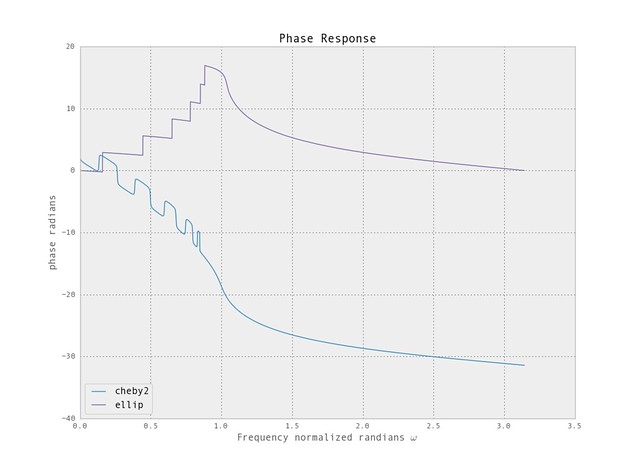
Highpass Filter

The following is a highpass filter design for the different filter types.  Refer to the previous post for information on the iirdesign function arguements and usage.

1iir_ex2_highpass 2iir_ex2_highpass_zoom 3iir_ex2_highpass_zoom 4iir_ex2_highpass_phase

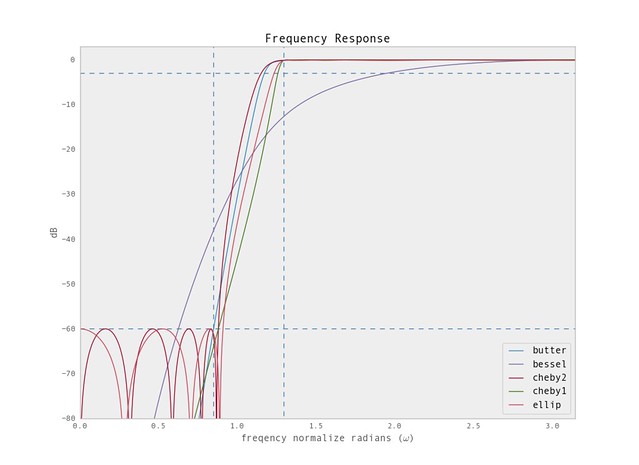
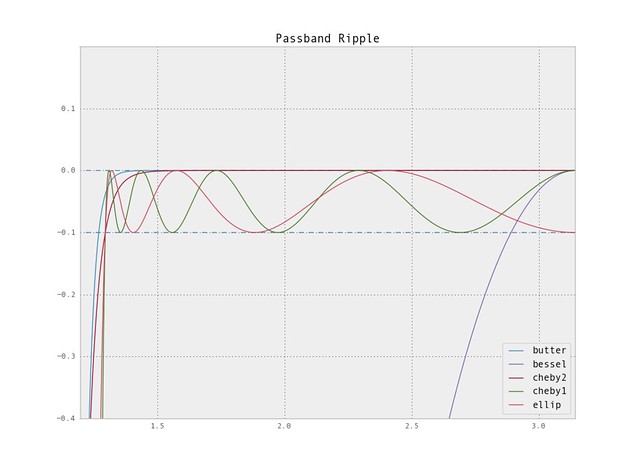
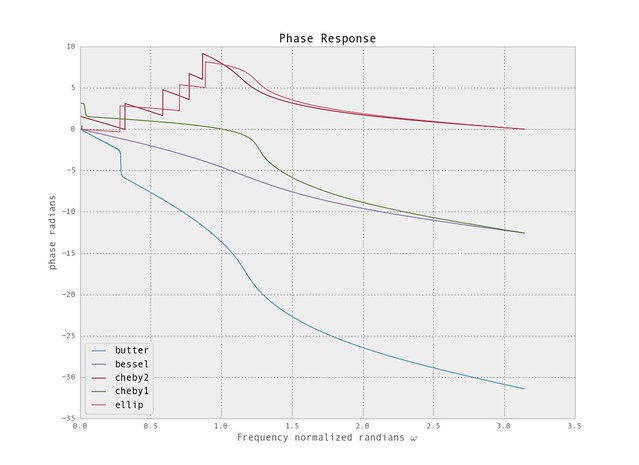
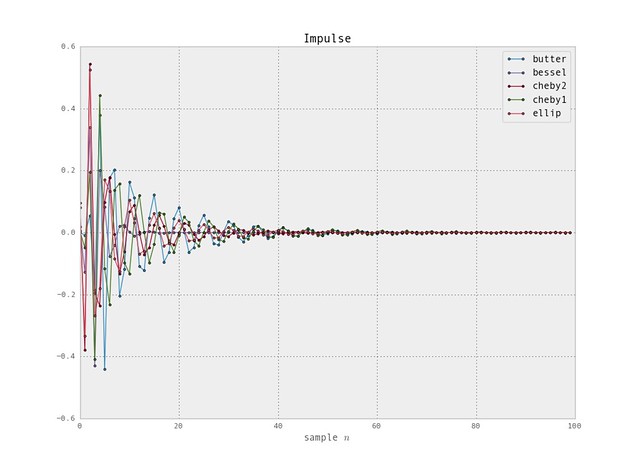
Again, similiar to the approach in the previous post tighter specifications can be given for the ellip and cheyb2 filter design.
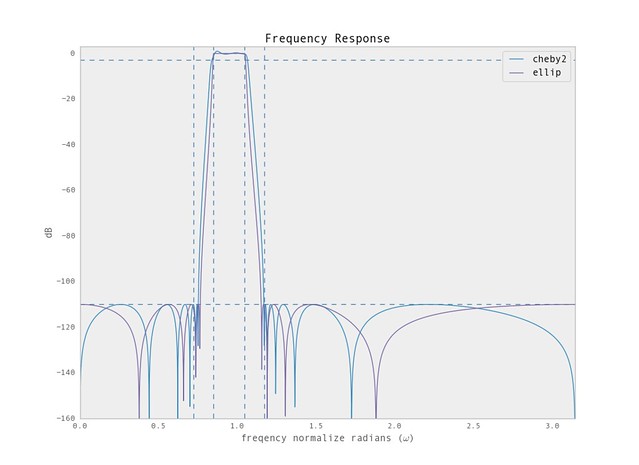
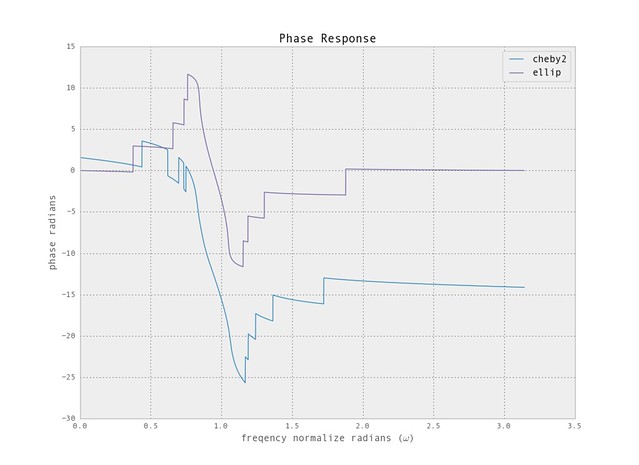
5iir_ex2_highpass2 6iir_ex2_highpass2_phase

Bandpass Filter

As mentioned, a bandpass filter coefficients can be created with the iirdesign function as well.  Since the iirdesign function is similiar for the different filter types we will only use the ellip and cheby2 for the rest of the examples.
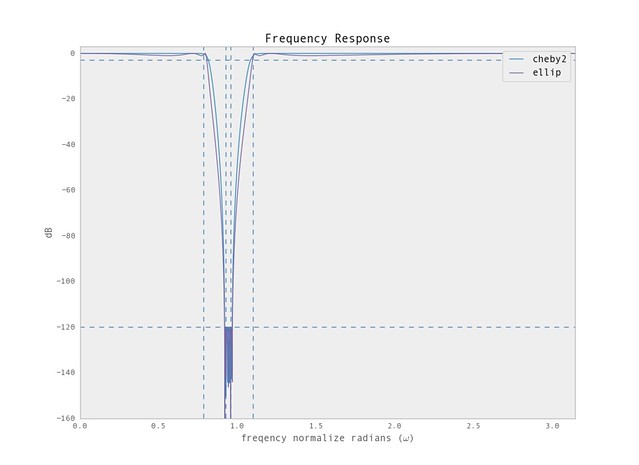
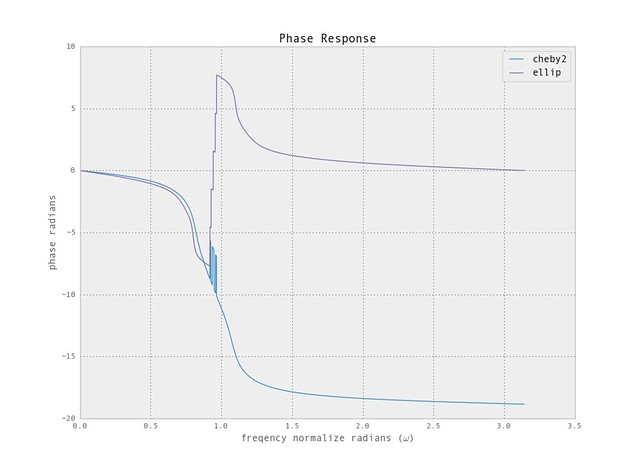
7iir_ex2_bandpass 8iir_ex2_bandpass_phase

Stopband Filter

And lastely here is an example to create a stopband filter.

9iir_ex2_stoppass 10iir_ex2_stoppass_phase
 
The scipy.signal iirdesign function, similiar to other signal processing packages, is a flexible tool to design and generate filter coefficients for an IIR filter.


[ - ]
Comment by fwkzNovember 12, 2012
How exactly do you compute phase response?
[ - ]
Comment by cfeltonNovember 12, 2012
In this case I am using the signal.freqz to generate the *complex* response. The phase is the angle of the complex values. I can say w,H = signal.freqz(b,a) and plot(w, angle(H))
[ - ]
Comment by cfeltonNovember 12, 2012
This code snippet includes and example using the signal.freqz and plotting the response, http://www.dsprelated.com/showcode/270.php
[ - ]
Comment by fwkzNovember 13, 2012
What about phase response in previous post? Phase characteristic is completely different, much more smooth. I execute code from previous example and I get completely different shape.
w,H = signal.freqz(b,a) and plot(w, angle(H)) doesn't make sense there. How do you compute it?
[ - ]
Comment by cfeltonNovember 13, 2012
Asking the question in one post is sufficient. If you look at the other post I attempted to answer the question.
[ - ]
Comment by fwkzNovember 13, 2012
I'm really sorry for redundancy but when I post my comment and come back here in couple of hours to see If someone replied I can't really see my comment so I just don't know if it's up here anymore. Right now I can only see your posts Chris. :
[ - ]
Comment by cfeltonNovember 13, 2012
@fwkz, my apologies, for non-register users I have to approve the comments. I forgot to hit the "approve" and only hit the "reply". Thanks for pointing this out.

To post reply to a comment, click on the 'reply' button attached to each comment. To post a new comment (not a reply to a comment) check out the 'Write a Comment' tab at the top of the comments.

Please login (on the right) if you already have an account on this platform.

Otherwise, please use this form to register (free) an join one of the largest online community for Electrical/Embedded/DSP/FPGA/ML engineers: