


Using the DFT as a Filter: Correcting a Misconception
I have read, in some of the literature of DSP, that when the discrete Fourier transform (DFT) is used as a filter the process of performing a DFT causes an input signal's spectrum to be frequency translated down to zero Hz (DC). I can understand why someone might say that, but I challenge that statement as being incorrect. Here are my thoughts.
Using the DFT as a Filter
It may seem strange to think of the DFT as being used as a filter but there are a number of applications where this is done. For example, we can use the DFT to implement a bank of bandpass filters used in some sort of subband coding application, or use the DFT to implement a bank of bandpass filters for a straightforward spectrum analysis application such as a weighted overlap and add (WOLA) spectrum analyzer [1-5].
The general process of using the DFT as a filter is illustrated in Figure 1. An N-sample x(n) input sequence enters a tapped-delay line, is multiplied by a w(k) window sequence, and the u(n) product sequence is applied to an N-point DFT. Windowing with a w(k) sequence is optional, based on the our DFT filterbank application. For “rectangular windowing” the w(k) window sequence would be all ones and the multiplication by the w(k) sequence in Figure 1 becomes unnecessary.
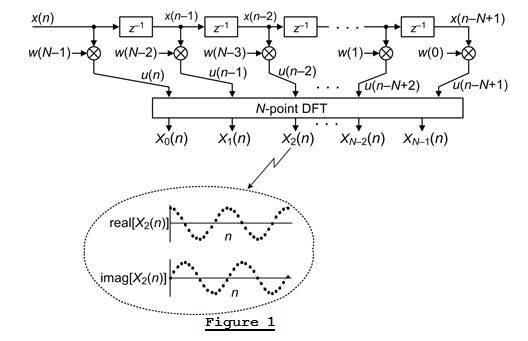
If the w(k) window sequence is all ones, as each new x(n) sample enters the tapped-delay line we compute a new output sample for each of the DFT's Xm(n) output sequences. The subscripted m index in Xm(n) represents the mth DFT bin where m is in the range 0 ≤ m ≤ N-1. Looking at the m = 2 DFT bin, inside the oval of Figure 1 shows a hypothetical, complex-valued, X2(n) time-domain output sequence.
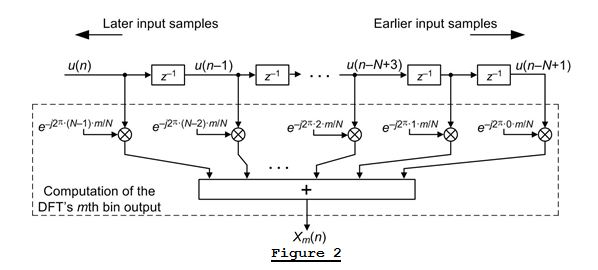
In viewing the computation of a single DFT bin output as the output of a tapped-delay line finite impulse response (FIR) filter, we can show the Figure 1 u(n) sequence as the input to an N-point DFT, as shown in Figure 2. The dashed rectangle in Figure 2 shows the computations needed to compute a single mth bin output sequence Xm(n).
An Easy Mistake to Make
Again, the misconception I referred to at the beginning of this blog, regarding the use of the DFT as a filterbank of bandpass filters as shown in Figure 1 or as a single bandpass filter as shown in Figure 2, is that when used as a filter the DFT translates spectral energy down in frequency such that all of the DFT's mth bin output signals are centered at zero Hz (DC). I believe this is not true, and here's why:
You see, when implementing the standard N-point DFT equation,
we're correlating the e-j2πnm/N twiddle factors with an x(n) input sequence. In an FIR implementation we're convolving the e-j2πnm/N twiddle factors with an x(n) input sequence, and that means from an FIR filter viewpoint the order of the e-j2πnm/N twiddle factor coefficients must be flipped relative to their order in a standard DFT. Figure 2 illustrates what I'm saying here. Notice in Figure 2 how the largest DFT twiddle factor coefficient e-j2π⋅(N-1)⋅m/N is on the left side, and the smallest twiddle factor coefficient e-j2π⋅0⋅m/N is on the right side, of Figure 2's tapped-delay line.
I've seen two Internet DSP tutorial websites, as well as a recently-published DSP textbook, that had the twiddle factors incorrectly reversed in order when the authors were discussing using the DFT as a filter. That is, they mistakenly had the e-j2π⋅0⋅m/N twiddle factor coefficient on the left side of the tapped-delay line, ...and that's a VERY easy mistake to make. (I don't know if the Professor on Gilligan's Island or Sheldon Cooper on THE BIG BANG THEORY would make that mistake, but some people do.)
The critical point here is that the DFT twiddle factors in Eq. (1) comprise a negative-frequency complex exponential, while the twiddle factor coefficients in Figure 2 comprise a positive-frequency complex exponential.
Improper ordering of the DFT twiddle factors, when trying to perform a mathematical analysis of the Figure 2 FIR filter, leads to an incorrect equation for the frequency response of the DFT's mth bin FIR filter.
The Frequency Response of the DFT's mth Bin
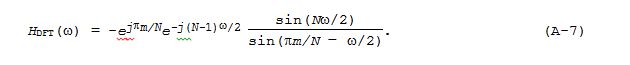
As derived in the Appendix A, the frequency response of the mth bin of Figure 2's N-point DFT is:
where frequency variable ω is –π ≤ ω ≤ π measured in radians/sample. The |HDFT(ω)| magnitude response of HDFT(ω) is a sin(x)/x-like bandpass filter response centered at a frequency of:
![]()
That ωcntr center frequency is the value of ω where the angle argument of the ratio's denominator equals zero in Eq. (2). The spectral magnitude |HDFT(ω)| for N = 16 and m = 4 is shown in Figure 3(a). There we see that the main lobe of |HDFT(ω)| is located at a frequency of ωcntr = 2π4/16 = 0.5π radians/sample (one fourth of the input signal's sample rate measured in Hz). The linear phase response of this example HDFT(ω)'s passband is given in Figure 3(b).
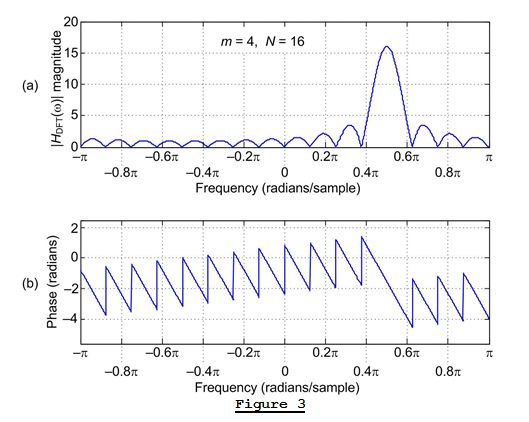
Figure 3(a) illustrates why we can treat consecutive time-domain output samples of a DFT's mth bin as the output of a complex bandpass filter.
A Simple Example
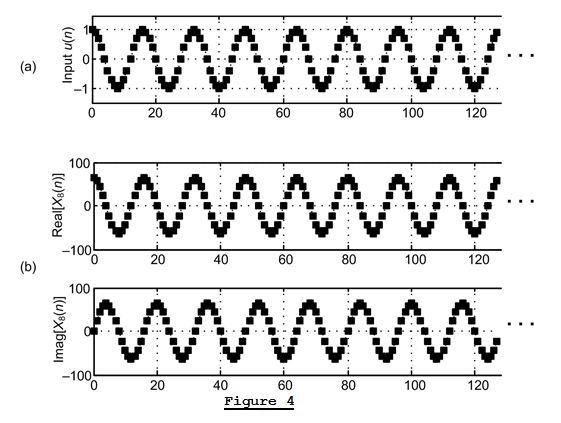
Figure 4 shows a simple example of how the DFT, used as a filter, does not induce frequency translation as some people claim. Figure 4(a) shows a sinusoidal u(n) input sequence whose frequency is fs/16, where fs is the u(n) sample rate is Hz. (There are 16 samples/cycle in u(n)). A block of N = 128 samples of sequence u(n) contains exactly eight sinusoidal cycles. The complex X8(n) output of a 128-point DFT's m = 8 bin is shown in Figure 4(b). Each complex
X8(n) = Real[X8(n)] + jImag[X8(n)]
sample in Figure 4(b) represents the output of the m = 8th bin of consecutive 128-point DFTs.
Notice how the real and imaginary parts of X8(n) also contain 16 samples/cycle, as did the u(n) input sequence. NO frequency translation occurs in the DFT's X8(n) bin time-domain output sequence!
Here's Where Frequency Translation Can Occur
In some applications of the DFT used as a filterbank, a frequency down-conversion does occur. Because Figure 2's Xm(n) output sequence is narrow in bandwidth relative to the bandwidth of the input u(n) sequence, some DFT filterbank practitioners decimate the Xm(n) sequence by N as shown in Figure 5. That decimation process frequency translates a DFT bin's Xm(n) spectral energy, originally centered at 2πm/N radians/sample, to be centered at zero Hz (DC).
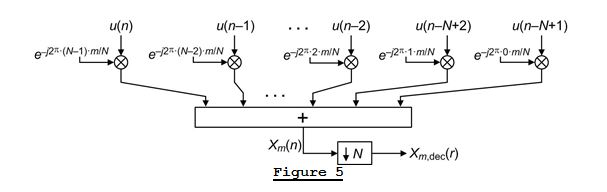
The decimated-by-N Xm,dec(r) sequence in Figure 5 is:
![]()
and the output index r is r = 0,1,2,3,…. For example, the u(n) input sequence in Figure 4(a) is a sinusoid whose frequency is centered exactly at the m = 8 bin. If that u(n) sequence had been thousands of samples in length, decimating the real and imaginary parts of X8(n) by N = 128 produces an all-ones sequence and an all-zeros sequence, respectively. If a lengthy u(n) sequence's frequency had been ±Δ radians/sample above or below the m = 8 bin's center frequency, the decimated complex X8,dec(r) sequence would have a frequency of ±Δ radians/sample.
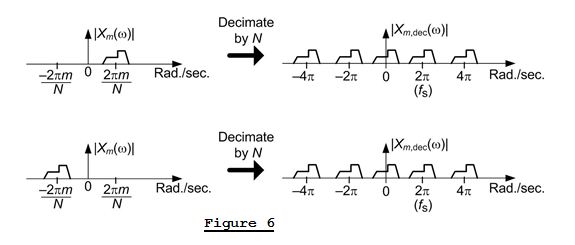
The interesting thing about the ʹfrequency translation through decimation by Nʹ process, shown in Figure 6, is that the spectral energy in any Xm(n) sequence is frequency translated to be centered at zero Hz regardless of the value of m. The top panel of Figure 6 shows the frequency translation if m is a positive integer. The bottom panel of Figure 6 shows the frequency translation if m is a negative integer.
Conclusion
To recap the main points of this blog we can say:
- Computing consecutive mth bin output samples of an N-point DFT can be viewed as a tapped-delay line complex-valued FIR filter as shown in Figure 2.
- The linear phase frequency response of the DFT's mth bin filter is a sin(x)/x-like passband centered at 2πm/N radians/sample (mfs/N Hz).
- When a new mth bin output sample is computed, upon the arrival of each new delay line input sample, the DFT's mth bin output sequence exhibits no frequency translation.
I end this blog by pointing out that what I haven't yet figured out is “How can the Figure 2 FIR bandpass filter have linear phase when its coefficients are not symmetrical?”
Postscript (August 2015)
I have an answer to the above linear phase bandpass filter question at:
https://www.dsprelated.com/showarticle/808.php

References
[1] Lyons, R. Understanding Digital Signal Processing, 2nd Ed. & 3rd Ed., Prentice Hall Publishing, Hoboken, NJ, 2010, Chap. 13, Section 13.20.
[2] Crochiere, R., and Rabiner, L. Multirate Digital Signal Processing, Prentice Hall, Englewood Cliffs, NJ, 1983 pp. 315-319.
[3] http://www.rfel.com/download/W05012_Architectures_for_SDR_Channelisation.pdf
[4] http://www.onsemi.com/pub_link/Collateral/AND8382-D.PDF
[5] http://www.onsemi.cn/site/pdf/ICECS2003_ASR.pdf
Appendix A [Derivation of Eq. (2)]
We can determine the frequency response of the mth bin of an N-point DFT by treating the Figure 2 block diagram as a simple tapped-delay line finite impulse response (FIR) filter. Doing so we see that the coefficients of the Figure 2 FIR filter are:

where time index p is 0 ≤ p ≤ N-1. Because e-j2πmN/N = 1, we can simplify Eq. (A-1) as:
Next we use the discrete-time Fourier transform (DTFT) definition to find the HDFT(ω) frequency response of the hDFT(p) coefficients as:
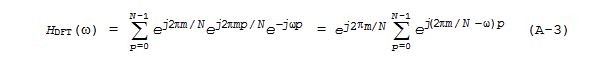
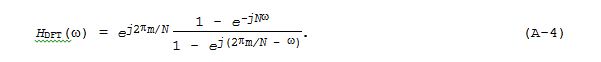
where frequency variable ω is –π ≤ ω ≤ π measured in radians/sample. The summation in Eq. (A-3) is a geometric series, so we can set Eq. (A-3) equal to:
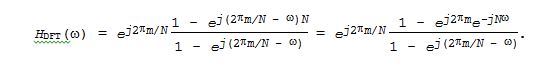
Because ej2πm =1, we have:
Factoring out the half-angled exponentials e-jNω/2 and ej(πm/N-ω/2), we have:
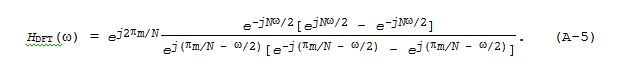
Using Euler's identity, ejα - e-jα = 2jsin(α), we arrive at

Canceling common factors and rearranging terms, the frequency response of our N-point DFT's mth bin bandpass filter is:


- Comments
- Write a Comment Select to add a comment

Thanks for another great post. For a couple years I had
the fortune to work with the group that generated
references [4] and [5]. I was working for a hearing-aid
company that was internally developing their own WOLA
until our R&D design site was sold to the group that
generated the aforementioned references.
As it is with many semiconductor and high-tech, there was
numerous selling of divisions, consolidations, etc. The
design group I was part of is no longer around, vanished
into the design center oblivion. But they were some good
years while it lasted.

How can the Figure 2 FIR bandpass filter have linear phase
when its coefficients are not symmetrical?
THAT(!) is the question. And Ive asked myself that question many times.
HLK1970, do you have access to Oppenheims & Schafers DSP book? In their first edition, Figure 3.32(c), they show real-valued asymmetrical coefficients of a nonrecursive FIR filter that they claim is linear phase. (That figure is Figure 3.35(c) in their 2nd edition). Weird huh, real-valued asymmetrical coefficients having linear phase. The problem is, Im unable to model that FIR filter and obtain linear phase as they claim. Id be interested in what happens if you, HLK1970, try to model that filter.
HLK1970, you wrote,
In Figure 2 you have plotted the real and imag parts
of the impulse response for a single DFT bin.
Nope, my Figure 2 is a block diagram. I didnt provide any impulse response plots in my blog.
You wrote:
In the "real world" we would implement a pair of frequency
bins, centered on zero.
Im not sure what is a pair of frequency bins centered at zero. Are you talking about the DFTs zero-Hz bin (DC bin)? How can you have two bins centered at zero?
[-Rick-]
By "a pair of frequency bins centred on zero" I meant that if you are interested in the mth frequency bin, with a relative frequency of m/N cycles per sample (using your symbols from your fig 2) then, as you are using complex math, you would need to actually apply two filters in parallel for this frequency - one at +m/N, and its complex conjugate partner at -m/N. When their outputs are summed the imaginary part cancels. In your fig 2 you only have the +m/M bin.
I probably should have written "symmetric around zero".
Regards,
HLK
Did you mean O&S's 1975 "Digital Signal Processing" book? I couldn't find a figure 3.32 in there.
Regards,
HLK
Please forgive me for I am unable to read your mind. What is it you are saying in your comment?
[-Rick-]
I just picture it in my head. The real part of an FIR filter based on the DFT would look like a rectangular window with an integer number of cosine waves. The imaginary part would have an integer number of sine waves. The midway point would have even real symetry odd imaginary symetry. This would mean the filter has a linear phase response.
It can be shown mathematically by expressing the coefficients in rectagular form using cosine and sine and noting that cosine has even symetry about integer multiples of pi and sine has odd symetry about integer multiples of pi.
Thanks for all your great articles! They have really helped me gain insight into the world of DSP.
-Dan
If you have a copy of my DSP book and would like me to send the book's errata to you, please ask the webmaster here (Stephane Boucher) to send me your E-mail address. I'll be happy to send you the errata.
[-Rick-]
How can the Figure 2 FIR bandpass filter have linear phase when its coefficients are not symmetrical?
Here are my thoughts, for what they are worth ...
In Figure 2 you have plotted the real and imag parts of the impulse response for a single DFT bin. In the "real world" we would implement a pair of frequency bins, centered on zero. The complex sinusoids corresponding to each bin would have the same frequency, but they would be complex conjugates of each other. When the coefficients of the two DFT filter bins are summed, the imaginary parts cancel, leaving the real part, which would be symmetric around the middle of the analysis window (if there are an odd number of taps).
Reading your last two posts, it seems to me that the real world process youre referring to is equivalent to some sort of real-valued bandpass filter. But thats not the process in my Figure 2. My Figure 2 refers to performing consecutive DFTs. That is, perform one DFT each time a new u(n) input sample arrives at the input of the tapped delay line in my Figure 2, and then examine the consecutive output samples of a single Xm(n) DFT bin.
Regarding my reference to O&Ss DSP book, forgive me for not being more specific. I meant the 1st and 2nd editions of their Discrete-Time Signal Processing book. (Not their 1975 Digital Signal Processing book.) Again HLK, Id be tickled if you could take a look at their Discrete-Time Signal Processing 1st editions Figure 3.32(c) [or their 2nd editions equivalent Figure 3.35(c)] and see if youre able to duplicate what they claim are real-valued, asymmetrical, tapped-delay line FIR filter coefficients that exhibit linear phase. For the life of me I wasnt able to duplicate what they claimed were their linear-phase results.
I welcome further discussion.
See Ya,
[-Rick-]
Sorry, I couldn't find the figures in those books either. But I have enjoyed "reading" them all - especially the 1975 one!
Regards,
HLK
... No, it was Rabiner's and Gold's 1975 book that I found next to the 1975 O&S book in the digital hardware section of our library that I liked - lots of new perspectives.
I know this is old, but it seems nobody commented on your question about the O&S linear phase example. I am looking at the second edition (this one: http://www.amazon.com/Discrete-Time-Signal-Processing-2nd-Prentice-Hall/dp/0137549202/). You may be referring to Figure 5.35, on page 294.
Although only 19 samples are plotted in that figure, h[n] is infinite in duration. When you say you were not able to replicate the "linear phase" claim, did you maybe truncate h[n]? If you did truncate, that probably made the filter non-linear-phase. This is why symmetric filters are useful; they preserve linear phase when a window (rectangular or otherwise, but symmetric) is applied. This is not the case with non-symmetric filters. O&S briefly refer to this in section 5.7.3. when they say that the symmetry conditions are sufficient, but not necessary, for linear phase.
Cheers,
Alen
Re. your question on linear phase:
A filter with linear phase may be achieved by an FIR filter which is either symmetric OR anti-symmetric.
(from wikipedia, http://en.wikipedia.org/wiki/Linear_phase)
Hope that helps!

Hi Rick,
I now this post is from long ago, but I am working in the implementation of a polyphase filter bank and understanding the filter view of the DFT it's important to me. I have some doubts about it. If I write down the DFT equation I cannot get to the plot on figure 2. I always have the time index in the exponentials, and in Figure 2 those coefficients do not depend on that.
Another very basic question arises. If you take a window of N points for the input sequence, and the filter is N points length, the convolution sum will give you 2N-1 points. I imagine that should be the same that applying 2N-1 DFTs to the same input and looking at the m output for each computation? However, the question is: for computing 2N-1 DFTs, I would need a input sequence that is that length? Or I should "slide" the DFT starting from -inf to +inf and just keeping the 2N-1 outputs that will be different from zero?
Hope you have time to answer. I would like to take a course with you you are amazing!!!
Thank you,
Leandro
Hi Leandro. (Thank you for your kind words.)
In your 1st paragraph you wrote, "If I write down the DFT equation I cannot get to the plot on figure 2." I think you meant to write, "If I write down the DFT equation I cannot get to the plot on figure 3(a)."
If you have MATLAB software then try running the following code to obtain the curve in my blog's Figure 3(a):
N = 16; n = 15:-1:0; m = 4;
B = exp(-j*2*pi*n*m/N); % Coefficients in blog Figure 2.
Freq_Resp = fft(B, 256);
Freq_Resp = fftshift(Freq_Resp);
Freq_Resp_Mag = abs(Freq_Resp);
figure(1), clf
plot((-128:127)/128, Freq_Resp_Mag), grid on, xlabel('Freq (x pi)')
[ImpResp,T] = impz(B,1,20);
figure(2), clf
plot(0:19, real(ImpResp), ':bo', 0:19, imag(ImpResp), ':rs')
grid on, title('Blue= real(ImpResp), Red = imag(ImpResp)')
Examine the impulse response very carefully. Those impulse response samples are the coefficients in my blog's Figure 2.
I'm not sure what you are saying in your 2nd paragraph. But let's remember with regard to convolution with a 128-sample input sequence, when you have a K = 128 tap filter the first 127 (K-1) filter output samples are the "beginning" transient response and those samples are not valid. That's because it takes 128 input samples to fill the filter's delay line.
Also with convolution, when you have a 128-tap filter the last 127 (K-1) filter output samples are the "ending" transient response and those samples are not valid because the filter's delay line does not contain 128 input samples.
So when convolving a 128-sample input sequence with a K = 128 tap filter, the first 127 filter output samples are not valid, the 128th output sample *IS* valid (because the filter's delay line now contains 128 samples of the input signal), and the last 127 output samples are not valid. So of those 255 filter output samples only one output sample is valid.
To obtain the complex-valued X_8(n) output sequence in my blogs Figure 4(b) using the DFT, you must have 255 x(n) input samples available to you [x(0) –to- x(254)]. To obtain the complex-valued X_8(n) output sequence in my blogs Figure 4(b) using the DFT, you must perform 128 separate DFTs and save each DFT's X_8() output sample.
The X_8(0) output sample comes from the DFT of input
samples x(0) –to- x(127).
The X_8(1) output sample comes from the DFT of input
samples x(1) –to- x(128).
The X_8(2) output sample comes from the DFT of input
samples x(2) –to- x(129).
. . .
. . .
The X_8(126) output sample comes from the DFT of input
samples x(126) –to- x(253).
The X_8(127) output sample comes from the DFT of input
samples x(127) –to- x(254).
I hope what I wrote makes sense. Leandro, let us continue to discuss the topic of your 2nd paragraph.
[-Rick-]
To post reply to a comment, click on the 'reply' button attached to each comment. To post a new comment (not a reply to a comment) check out the 'Write a Comment' tab at the top of the comments.
Please login (on the right) if you already have an account on this platform.
Otherwise, please use this form to register (free) an join one of the largest online community for Electrical/Embedded/DSP/FPGA/ML engineers:


