


Python scipy.signal IIR Filter Design
Introduction
The following is an introduction on how to design an infinite impulse response (IIR) filters using the Python scipy.signal package. This post, mainly, covers how to use the scipy.signal package and is not a thorough introduction to IIR filter design. For complete coverage of IIR filter design and structure see one of the references.
Filter Specification
Before providing some examples lets review the specifications for a filter design. A filter is usually defined in the frequency domain. The following figure depicts the frequency domain specification.
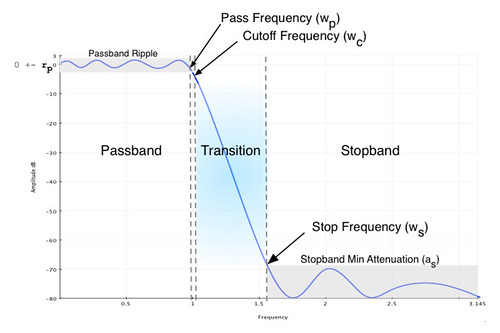
The specification figure illustrates a low-pass filter but the terminology applies to all filter types, lowpass, highpass, bandpass, and stopband.
- Passband (Wp) : This is the frequency range which we desire to let the signal through with minimal attenuation. In the scipy functions this is in normalized frequency, 1 > Wp > 0.
- Stopband (Ws) : This is the frequency range which the signal should be attenuated. Again, in scipy this is in normalized frequency, 1 > Ws > 0.
- Passband ripple (Rp, gpass) : The max variation in the passband, in decibals.
- Stopband attenuation (As, gstop) : The max level in the stopband or in other words the min attenuation in the stopband, in decibals.
NOTE: The cutoff frequency is the -3dB point. If the cutoff frequency is required the algorithm will work to meet the -3dB point at the Wc frequency. The pass frequency, Wp, is the last, first, or first and last frequencies in the passband which the Rp value occurs (the rest are less). See the zoomed in frequency plots below for an example.
The above specifications are the information that will be used and passed to the IIR filter design functions. In addition to our filter specification information we need to select our "filter" type. The following table summarizes the different IIR filter design approaches supported by the scipy.signal design functions. The following table was taken verbatim from [4].
| Filter |
| Passband | Stopband | Phase | Comments |
|---|---|---|---|---|---|
| Bessel | Knee? What knee? | Monotonic | Monotonic | Near-linear | s-to-z mappings distort phase. FIR usually more efficient for linear phase |
| Butterworth | Rounded | Maximally flat, monotonic | Monotonic | nonlinear near cutoff | Easy to design by had Maple syrup is better on waffles |
| Chebychev I | Sharp | Ripples | Monotonic | Worse | Easy to design by hand |
| Chebychev II | Sharp | Monotonic | Ripples | Worse | Somewhat more complicated design than Chebychev I |
| Elliptic | Maximally sharp | Ripples | Ripples | Drunk fly on cross- country skies in a tornado | Not viable for design by hand |
Side note, the Digital Signal Processing and the Microcontroller book has some great -geek- humor.
Discrete Filter Design
If it wasn't already known, now we know the information needed to use the scipy.signal IIR filter design functions. Let's look at the scipy.signal.filter_design.iirdesign function arguments.
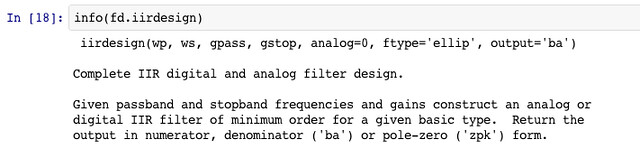
A couple comments on the arguments to the iirdesign function; wp is the pass frequency, this is the last point where gpass (Rp) occurs. And ws is the frequency where the magnitude will be less than -gstop (As). The wp and ws arguments are in normalized frequency, 0 < wp (ws) < 1, where 1 is the Nyquist frequency. And gpass and gstop are defined in decibals. ftype is the filter design type, which can be one of the following ['ellip', 'butter', 'cheby1', cheby2', 'bessel']. For additional information see the iirdesign documentation.
To design an IIR filter in python.scipy we are going import the basic numerical, scientific, and plotting packages.
Then create the coefficients for each of the filter types.
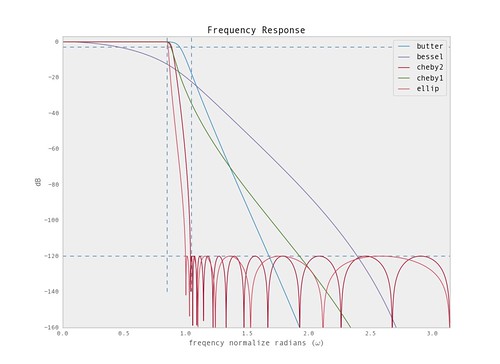
Plotting the frequency response for the designed filters we get the following.
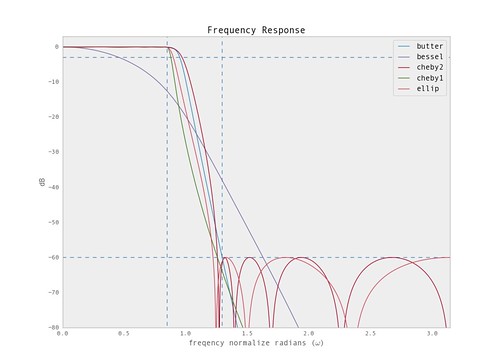
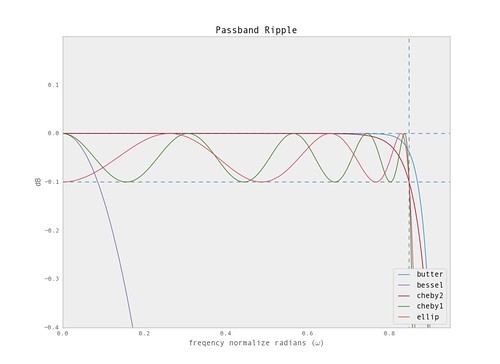
From the plots we can see that the 'ellip' and 'cheby2' have the steepest transition band. The others have fairly mellow transitions.
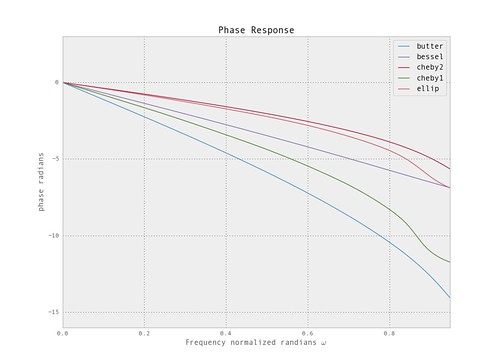
From the phase response we can see the bessel has near linear phase. But it is usually better to use a FIR if linear phase is required vs. trying to achieve the desired response with a higher order bessel.
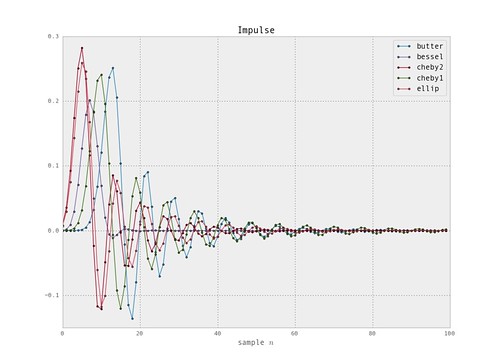
We can also plot the impulse response for each of the filters.
The elliptical and the chebychev 2 filters can do much better in the transition band. But to achieve the steeper transition need to pull in Ws. The butterworth and chebychev 1 filters would fail with a more aggressive Ws or lower As. The following plots show how we can build a more aggressive filter with the 'ellip' and 'cheby2' filters.
Functions: iirdesign and iirfilter
The iirdesign takes our filter specifications and uses one of the IIR filter design methods to generate the coefficients. The design methods determine the order of the filter. The iirfilter function will take the desired order. There are other functions to help determine the order per the specifications. The response will be based off the order vs. trying to achieve some set of specifications.
Look for the next post where examples for highpass, bandpass, and stopband will be covered using the iirdesign function. For more information and background, Rick Lyon's Understanding Digital Signal Processing is always a good place to start.
Software Acknowledgements
Different open-source packages and sources were used. Here I try and mention a couple; the sane mpl color scheme was used in all the plots. And the ipython qtconsole and notebook were used to generate plots and experiment with the scipy functions.
References
[1] R. Lyons, "Understanding Digital Signal Processing",
      2nd ed., Prentice Hall, Upper Saddle River, New Jersey, 2004
[2] A. Oppenheim, R Schafer, and J. Buck, "Discrete-Time Signal Processing",
      2nd ed., Prentice Hall, Upper Saddle River, New Jersey, 1999
[3] S. Smith, "The Scientist and Engineer's Guide to Digital
      Signal Processing", Chp. 17.
[4] D. Grover and J. Deller, "Digital Signal Processing and the microcontroller",
      Prentice Hall, Upper Saddle River, New Jersey, 1999
[5] S. Orfandis, "Introduction to Signal Processing",Chp. 11.2, pg 566.


- Comments
- Write a Comment Select to add a comment

Thanks!
Hope that helps,
Chris
To post reply to a comment, click on the 'reply' button attached to each comment. To post a new comment (not a reply to a comment) check out the 'Write a Comment' tab at the top of the comments.
Please login (on the right) if you already have an account on this platform.
Otherwise, please use this form to register (free) an join one of the largest online community for Electrical/Embedded/DSP/FPGA/ML engineers:


