


Hi everybody,
i have to write a matlab function to calculate the signal and the snr in output from the Figure 1 circuit (direct form 2 transposed second-order-sections IIR filter).
The function takes in input the filter coefficients (zeros and poles vectors B and A), the signal x[n] and the quantization noise e[n].
The signal x[n] is supposed to be a 44.1kHz vocal audio, while the quantization noise e[n] is a zero mean uniform noise which power is a 1/1000 of x[n]'s power.
B and A are the coefficients of a low pass IIR filter with the following specifications:
- maximum allowed transition band: 200Hz
- cut-off frequency 8kHz
- minimum Astop=70dB
Using filterDesigner toolbox and setting elliptic IIR and minimum order I obtained a 14th-order filter which SOS is a 7x6 matrix
I wrote the circuit function in this way, but i think that i've made some mistakes in its calculation because the signal in output is almost fully covered by noise.
function [y,snr_dB,P_ey_dB] = funzione1(B,A,x,e)
%ritardo massimo
R=length(A);
L=length(x);
v = zeros(L,R);
y = zeros(L,1);
e_y = zeros(L,1);
for k=R+2:length(x)
for m=R-1:-1:1
v(k,m)=B(m+1)*x(k)-A(m+1)*y(k)+v(k-1,m+1);
e_y(k)=e_y(k)-A(m+1)*e_y(k-1);
end
y(k)=B(1)*x(k)+e(k)+v(k-1,1);
e_y(k)=e_y(k)+e(k);
end
P_sig = sum(y.^2)/length(y);
P_noise = sum(e_y.^2)/length(e_y);
P_ey_dB=10*log10(P_noise);
snr=P_sig/P_noise;
snr_dB=10*log10(snr);
end
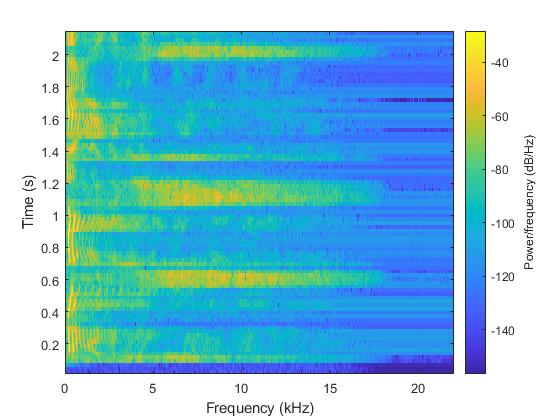
Figure 2: x[n] spectrogram
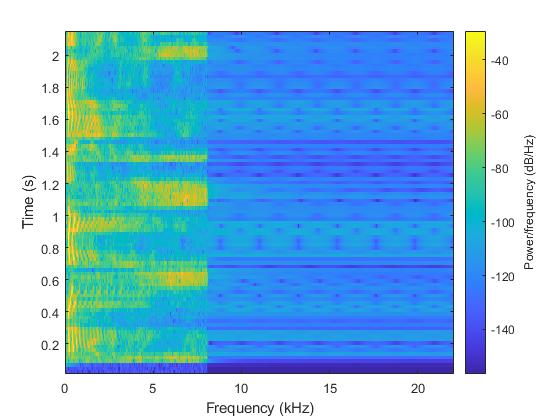
Figure 3: y[n] spectrogram
Figure 4: filtered signal using filter function directly non considering quantization noise
The main is:
load filterIIRLP
[data,fs]=audioread('SampleAudio.wav');
x=resample(data,441,320);
fs=441*fs/320;
%prendo solamente i primi 3sec della traccia audio
x=x(1:96000);
audiowrite('AudioSample.wav',x/max(abs(x)),44100);
figure('Name','Analisi spettrale del segnale in ingresso');
spectrogram(x,2048,1024,2048,fs);
P_ing=sum(x.^2)/length(x);
P_ing_dB=10*log10(P_ing);
e=0+sqrt(P_ing/1000)*rand(length(x),1);
P_e=sum(e.^2)/length(e);
P_e_dB=10*log10(P_e);
snr_ing_dB=10*log10(P_ing/P_e);
[B,A]=sos2tf(SOSiir,Giir);
[y,snr_out_dB,P_ey_dB]=funzione1(B,A,x,e);
figure('Name','Analisi spettrale del segnale in uscita');
spectrogram(y,2048,1024,2048,fs);
figure;
spectrogram(filter(B,A,x+e),2028,1024,2048,fs);
Can anyone do a quick check, please?
Thanks and sorry for my english. :)
EDIT: 04/04/2020 6:16pm

At first glance it appears your "function [y,snr_dB,P_ey_dB] = funzione1(B,A,x,e)" does work properly. I added a statement at the beginning of this function that zeros the noise vector (i.e. e = zeros(size(e));). With this change, the spectrums of the filtered signals generated using the FILTER function and your function are similar.
I would step through your function to double-check its implementation.
I hope this helps.

Hello Mr. Fragavetti,
here is a MATLAB script that I used to edit an audio file. You need to change the script for your needs.
Always look at the time signals. Instead of the spectrograms, you would have to do a wavelet analysis.
#############################
% Skript audio_1.m
clear;
% ------- Read audio file
S = load('handel.mat'); % Data in S.y and sample freq in S.Fs
S
% ------- Write audiosignal in wav File
audiowrite('handel.wav',S.y,S.Fs); % wav File
player = audioplayer(S.y,S.Fs);
play(player);
pause
figure(1);
plot((0:length(S.y)-1)/S.Fs, S.y);
La = axis; axis([La(1:2),-1,1]);
title('handel'); xlabel('s'); grid on;
% ------- IIR-Filter
[B,A] = ellip(14,0.1,70,800/(S.Fs/2)); % IIR-Filter
nfft = 512;
HB = fft(B,nfft);
HA = fft(A,nfft);
Hiir = HB./HA;
figure(2);
plot((0:nfft-1)*S.Fs/nfft, 20*log10(abs(Hiir)),'k-','LineWidth',1);
title('Amplitude response of the IIR-Filter in dB')
xlabel('Hz'); grid on;
% -------- Signal plus noise
ny = length(S.y);
%noise = sqrt(std(S.y)^2/1000); % Variance of noise
noise = sqrt(std(S.y)^2/10); % Variance of noise
y1 = S.y + noise*randn(ny,1); % Signal + noise
player = audioplayer(y1,S.Fs);
play(player);
pause;
figure(3);
plot((0:length(y1)-1)/S.Fs, y1,'k-','LineWidth',1);
hold on;
plot((0:length(S.y)-1)/S.Fs, S.y,'r-','LineWidth',1);
La = axis; axis([La(1:2),-1,1]);
title('Signal and signal with noise'); xlabel('s'); grid on;
% ------ Filtering the Signal
y2 = filter(B,A,y1);
player = audioplayer(y2,S.Fs);
play(player);
pause
figure(4);
subplot(211), plot((0:length(y1)-1)/S.Fs, y1,'r-','LineWidth',1);
title('The signal with noise');
subplot(212), plot((0:length(y2)-1)/S.Fs, y2,'k-','LineWidth',1);
title('The filtered signal');
% ------- Power spectral density
[Py, w] = pwelch(S.y, hamming(512),[64],[512],S.Fs,'twosided');
[Py1, w] = pwelch(y1, hamming(512),[64],[512],S.Fs,'twosided');
[Py2, w] = pwelch(y2, hamming(512),[64],[512],S.Fs,'twosided');
figure(5);
subplot(311), plot(w, 10*log10(Py),'k-','LineWidth',1);
title('Poer spectral density of the original signal');
xlabel('Hz'); axis tight;
subplot(312), plot(w, 10*log10(Py1),'k-','LineWidth',1);
title('Poer spectral density of the signal with noise');
xlabel('Hz'); axis tight;
subplot(313), plot(w, 10*log10(Py2),'k-','LineWidth',1);
title('Poer spectral density of the filtered signal');
xlabel('Hz'); axis tight;
#######################################


_94273.png)