


Is there any DAC math model around?
 Started by 1 year ago●18 replies●latest reply 1 year ago●251 views
Hi All,
I assume Matlab and other math tools do not have a dedicated function to model DAC or ADC.
I will try model DAC in digital domain:
- generate a clean single tone that shows FFT a single peak (in machine precision)
- quantise the levels to DAC resolution
- sample/hold by repeating each sample few times (also tried a zero in between repeated samples).
- optional shaping filter to emulate analogue continuity
- fft, shouldn't I expect to see below lovely lobes? but I don't...I can get lobes if I use impulse input instead of tone and do above steps.
So how to model DAC and see these lobes. You see them all over but never in digital domain and not even after my DAC model but I trust they are there in the analogue world and these sources never tell about point of observation.
It could be I have to use sinc filter instead of sample hold but not sure.

Many real-world applications of DACs either just use a zero-order hold, for the reason that downstream outputs filter the resulting high-frequency content, or add a simple first-order filter to roll off the high frequency content.
If you need to model the quantization in your system (e.g. 10-bit, 12-bit, 14-bit, 16-bit DAC), just do it...
You're showing sinc waveforms but I have no idea where they came from or what your intent is.
If you're going to take an FFT, make sure you understand the effects of sampling rate (how many samples per digital output update -- you say "by repeating each sample few times" so that sounds like you already know a bit about this issue -- don't put zeros in between repeated samples since that doesn't represent real-world output) and the choice of the number of cycles if you have a periodic waveform like a single tone.
I think you have the right general idea, but there is no single correct way to model a system. It depends on what your requirements are, and what you are trying to learn from the model.
Thanks jms_nh,
So the elements for DAC modelling are:
quantize, sample hold (no zeros), and check frequency domain (fft).
Input is a clean tone of exact cycles for fft frame to avoid smearing.
But I can't reproduce the lobes. Where are they? I see them all over discussions. I believe they are there! but need to see them.
Just quantize and sample & hold. And if you don't care about the effects of quantization, don't even bother with that.
What you do with the results is up to you; if you want to look at them in the frequency domain then take an FFT.
> I believe they are there! but need to see them.
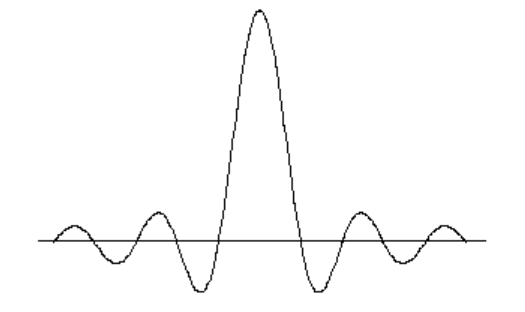
So a sinc pulse is the transform of a rectangular pulse, which is a single nonzero DAC output. If you're outputting sine waves in the time domain, then you'll see something closer to a spike at the sine wave frequency.

You state a lot of facts but give no details. You don't even label the graph. There are more questions than answers. "quantise the levels to DAC resolution" -- what resolution? What signal are you simulating? Are these in the expected DAC resolution bits? If so, how many bits? Are you using floating point or integers for data and/or FFT? If FP, what precision? How many samples in what representative time frame? Is the FFT in integer or FP? Again, to what precision for either? Why is the sky blue? Some of that depends on what's in the sky (e.g. pollutants), clouds, time of day, location on the planet, etc.
I recall my teachers in school would not give any points when no work was shown, but if one did show work, the teacher would give partial credit for showing the work so that the student actually presented a basic comprehension of how to solve the problem even when that answer had an error.
Your work is unfinished - you have a lot of explaining to do yet.
This is about generic model of any DAC, any input.
DACS are fixed point in the current big bang.
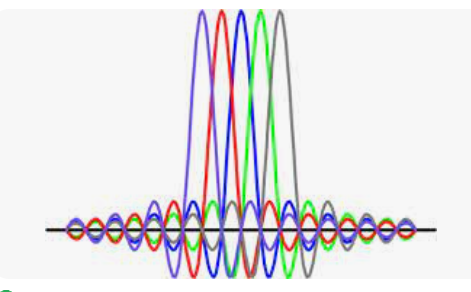
My example is about a single clean (ofdm) tone generated as complete cycles (using iFFT). If I do fft on the vector I get a single peak. But I know in analogue channel each has main lobe and multiple side lobes that are meant to cancel, out in frequency domain.
Here is a single tone diagram in frequency domain, from the web:
I guess the misunderstanding is the difference between a theoretical spectrum of a train of whole periods of a sine wave (which is a sinc function) and the FFT of that train. If you get a whole number of periods, the FFT shows only one component, because it 'samples' the theoretical spectrum exactly on all zeros and at 0. The FFT 'assumes' that the sine train is repeated (it 'matches with only one component) whereas the theoretical spectrum is from a once-occurring signal of n periods duration. The theoretical spectrum of a once-occurring signal is continuous as its 'period' is infinitely long.
Thanks broertonijn,
If I understood, you mean the lobes will be seen if spectrum is analysed in an analogue tool that say uses nonparametric estimate such as those in many labs. In which case yes I can insert initial zeros, repeat my tone many periods, tail off with zeros then yes I can see clear lobes.
I can add that to my model. But that could be due to another mechanism related to samples per cycle. I am not sure.
I was expecting a way to model sample and hold as the cause of lobes. Here is an excerpt:
"The zero-order hold is equivalent to convolving in the time domain the digital samples, which represent impulses in the time domain, with a rectangular pulse as wide as the time duration between samples. Convolution in the time domain is multiplication in the frequency domain, and therefore the DAC output will have a "droop" over frequency with the magnitude going to zero as the frequency approaches the sampling rate".
This is some code for modelling above, it doesn't show lobes:
%%%%%%%%%%%%%%%%%%%%%%%%%%%%%%%%%%%%%%%%%%%%%%%%%%
x= round(2^10*cos(2*pi*(0:1023)*100/1024)); %single tone quantised
y=zeros(1,1024*4); %for sample and hold on four samples
y(1:4:end)=x; y(2:4:end)=x; y(3:4:end)=x; y(4:4:end)=x;
h = round(2^10*ones(1,4)/4); %rectangular pulse of 4 samples
yf = round(filter(h,1,y)/2^10); %convolve with input
plot(abs(fft(yf)))
I don't catch the goal of your model. When you add zeros then you can approximate the continuous spectrum and you get a shifted sinc function. When you omit the zeros the period (= the duration of the signal you transform into the frequency domain), you 'sample' the continuous sinc function at multiples of T if T is the signal duration. This has nothing to do with the zeroth order of sampling. When you hold the sample during the sample interval, you convolve the 'non-holded' sampled signal with the pulse of the sample interval duration.
Maybe it an idea if you download my book about fundamentals of signal analysis. It is free downloadable from:
https://www.fon.hum.uva.nl/wempe/bookIntoSound/bookIntoSoud2.pdf
If you look at page 102 you'll see exactly what you do.The spectral effect of this zeroth order is on that page as well and the non-holdes sampling is shown on page 90.
Hope you can find something there to suit what you want.
Good luck.
I didn't add zeros in last model, just repeated samples...
Anyway I think I got some idea about my confusion:
I am aware of sinc lobes at DAC device, no issues, they are clearly stated in your book as well. They represent the amplitude profile of aliases of the tone in various Nyquist zones.
from AD DDS document:
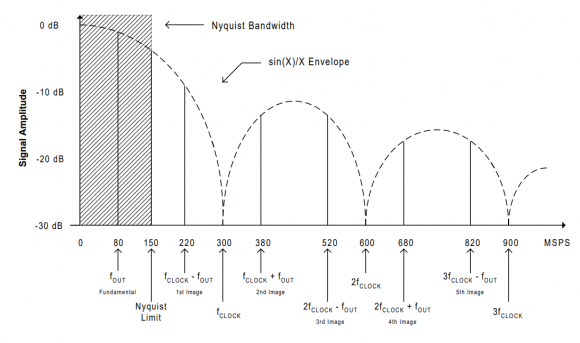
No problem with above. My problem is understanding diagrams like below, it seems the lobes are as well just for indicating the amplitude path of aliases of tones in various Nyquist zones plus secondary power spread per alias.
So are these two diagrams about same one concept? one with dotted lobes and the other solid lobes.
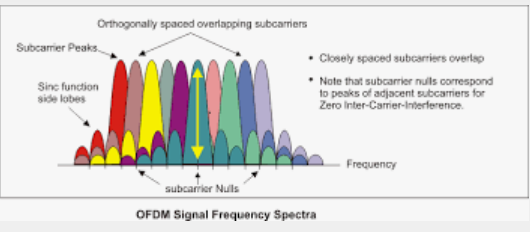

The plot of OFDM frequency bins is showing the overlap of signal energy from adjacent bins.
This is a completely different plot from D2A conversion. It is showing that the energy from adjacent bins cancels out in the center of the current bin. It is the basis of *Orthogonal* Frequency Division Modulation.
I don't disagree. The location of each tone and its aliases is same as first diagram (D2A) but each spreads power around with all nulls opposite peak of each tone (minimum intercarrier Interference).
The first diagram is for one tone. The second is for many tones.
This happened to be orthogonal but a DAC model should show lobes for any composite signal with or without orthogonality.
Hi Napierm, Broertonijn:
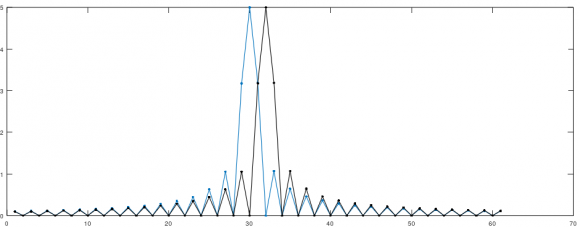
After some analysis I realised you are right, thanks. Those closely located spectral lobes - though sinc shaped - are not due to aliasing outside Nyquist, which is filtered anyway. For my mindset the keyword is "phase discontinuity" of running stream from whatever reasons. So they are present before or after DAC. I guess this happens to any signal for example the RRC pulse shaping for QAM targets same lobe cancellation per symbol. I tried this code on two ofdm tones:
x1 = zeros(1,1024); x1(100) = 1; %first ofdm symbol
x1 = real(ifft(x1));
x2 = zeros(1,1024); x2(101) = 1; %second ofdm symbol
x2 = real(ifft(x2));
s1 = abs(fft(x1,2048)); %break phase with zeros for plot color
s2 = abs(fft(x2,2048));
plot(s1(170:230),'.-'); hold; plot(s2(170:230),'k.-');

There aren't really any DACs that output a sinc function for each sample. That would be really ideal (in a theoretical sense) but it's a mathematical model for the reconstruction half of the Nyquist/Shannon sampling theorem.
Now, zero-order hold was mentioned and that is the appropriate model for conventional DACs, but there are also ΣΔ DACs and then the model is much more complicated.
I am focused on conventional DACs for self education. I would like to have DFT across several Nyquist zones. Conventional FFTs cover +- first Nyquist zone. I might repeat zones scaling each lobe by factor based on sinc function. There might be better ways of doing it using modified DFT equation.

I had this problem when trying to study the quantization effect in spectrum sensing precision for real implementations. I created a code in Matlab to perform the quantization according to a selected bit precision and to add a clipping behaviour. It originally considered any dynamic range as input, but I removed this later, and then the samples were normalized to the range -1 to +1. If it can help you some way, you can find the code here https://codeocean.com/capsule/1153872/tree/v1.

The code applied sample/hold then looks at fft but fft of any real signal is mirrored yet I am expecting the impossible to see sinc envelope as fft covers 0 to Fs only.
I figured it out that I need to extend fft by copying/mirroring then scale by sinc envelope. for example:
%%%%%%%%%%%%%%%%%%%%%%%%%%%%%%%%%%%%%%%%
x = round(2^10*cos(2*pi*(0:1023)*157/1024))/2^10;
xx = fft(x)/sqrt(1024); % 0 to Fs zone
xx =[xx, fliplr(xx)] ; % 0 to 2Fs zone
f = 0:1/1024:2-1/1024;
A = sin(pi*f)./(pi*f); %sinc envelope
xx = xx.*A;
plot(f,abs(xx));
hold
plot(f,abs(A)*16,'--')
%%%%%%%%%%%%%%%%%%%%%%%%%%%%%%
here is the plot:
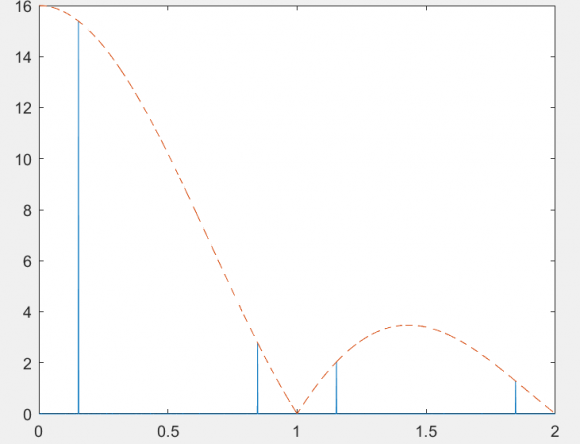
Almost there but needs to add Q spread factor of oscillation...and the lobes are expected.
So it is plenty work to account for a suitable number of Nyquist zones, or Q factor. Just wondered why such model is not available at least for intuitive purposes.
Thanks for all the contributions.
I would first search examples from MathWorks's FileExchange. DAC ADC
Maybe


