


Calculating the minimum phase of a given magnitude response
Hi,
I'm trying to calculate the minimum phase response of a given magnitude response (measured). It is well known that there is a 1:1 relationship between the magnitude response of a system and its minimum phase:
https://en.wikipedia.org/wiki/Minimum_phase#Relationship_of_magnitude_response_to_phase_response
Seems like a one-liner in #Matlab.min_phase = unwrap(-imag(hilbert(log(abs(H))))); %H is the FFT of some tf
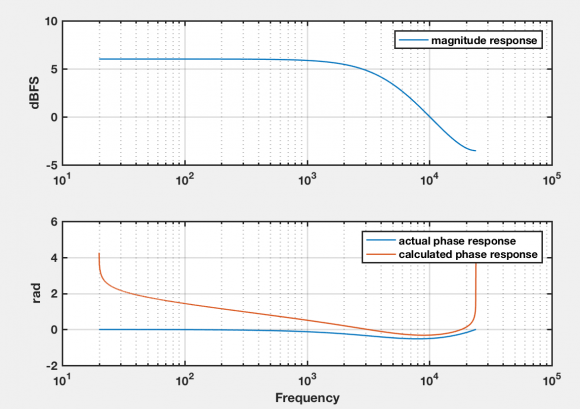
I never trust a line of code that I write, so to debug my implementation of this 'theorem', I tried to calculate the phase response of a known simple minimum phase filter. Since all stable allpole filters are minimum phase, I used this:
H = 1 / (1 - 0.5z^1)
I plotted the actual phase response, as well as the calculated one according to the theorem. You can see that it's not completely off, but not quite accurate. I was expecting larger error at low and high frequencies, since this is a sampled system and the Hilbert transform is probably not accurate for those frequencies. However the error is larger than I would have expected, and on a much larger band.
I don't really know what could be wrong with the code, so I'm wondering if this is really how good one can calculate the min phase for a sampled system...
Any thoughts/idea very welcome! Below is the code and responses.
fs = 48e3;
fgrid = 20:24e3/2^18:24e3;
b = 1;
a = [1 -0.5];
fvtool(b,a, 'Fs', fs)
tmp=freqz(b,a,fgrid,fs);
min_phase = unwrap(-imag(hilbert(log(abs(tmp)))));


figure;
subplot(2,1,1)
semilogx(fgrid,20*log10(abs(tmp)));
ylabel('dBFS', 'FontSize', 10);
legend('magnitude response'); grid on;

subplot(2,1,2)
semilogx(fgrid,unwrap(angle(tmp)));
hold all
semilogx(fgrid,unwrap(min_phase));
grid on;
xlabel('Frequency', 'FontSize', 10);
ylabel('rad', 'FontSize', 10);
legend('actual phase response', 'calculated phase response')Hi,
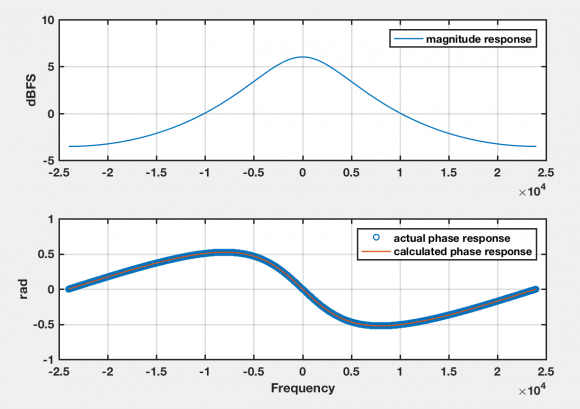
Actually, as I was posting this is occurred to me that the Hilbert transform probably wants to see the complete spectrum (not just positive frequencies...).
Fixed the frequency grid to include negative frequencies, and it works like a charm.
Ultimately my goal was to use this on a measured magnitude response from a real system, so I guess you do need to define it along the whole axis somehow by filling up the gap where one can't measure reliably (DC, Nyquist...).
Dave
fs = 48e3;
fgrid = -24e3:24e3/2^18:24e3;
b = 1;
a = [1 -0.5];

tmp=freqz(b,a,fgrid,fs);
min_phase = unwrap(-imag(hilbert(log(abs(tmp)))));

figure;
subplot(2,1,1)
plot(fgrid,20*log10(abs(tmp)));
ylabel('dBFS', 'FontSize', 10);
legend('magnitude response'); grid on;

subplot(2,1,2)
plot(fgrid,unwrap(angle(tmp)), 'o');
hold all
plot(fgrid,unwrap(min_phase), 'LineWidth', 2);
grid on;
xlabel('Frequency', 'FontSize', 10);
ylabel('rad', 'FontSize', 10);
legend('actual phase response', 'calculated phase response')

Yes, Matlab's hilbert() function expects a complete period of a periodic input signal, in this case it needs a complete period of the log-magnitude response around the unit circle.
I have a blog on a different (but ultimately equivalent, for periodic spectra) cepstral-folding method for this problem here: https://www.dsprelated.com/showcode/20.php

Thank you for your update. You just reminded me of something I should have already known.
Hi,
It's interesting how you quickly start to get errors once the magnitude is not defined across the whole bandwidth. For example, say you only have magnitude data from 200Hz to 20kHz (for a 48k sampling rate), simply repeating the 200Hz point down to DC and repeating the 20kHz point up to 24k on the properly spaced grid will yield relatively large error.
It seems like you have to properly extrapolate the response to keep error manageable.
Dave


