Magnitude/phase vs real/imaginary
In DFT plots, multiple plots are shown. One if magnitude/phase and second one being, real/imaginary.
One can look at magnitude part of the plot and get an idea about how the frequency components are suppressed by the system. What information can be obtained looking at real or imaginary plots?
Both the plots are same.
Magnitude/Phase plot is observed from Real/Imaginary plot.
Magnitude is obtained from Real and Imaginary components
Phase is angle of Real/Imaginary point.
Phase conveys the information related to delay.

Not just DFT but in general it is rectangular Versus polar versions of same vector.
They carry same info. For us amplitude & phase is more visual but for computations Re/Im is more convenient.
I agree but my question is, what inference I can draw by looking at a re/im plot? I have looked at a few plots and I cant make much sense out of it. Magnitude/Phase is a different story

I agree but my question is, what inference I can draw by looking at a re/im plot?
Usually I infer that I wish the author of the plot had used magnitude/phase.
Not much, I will leave rectangular form for computations. I and you as "human GUI" will look at amplitude/phase.
for single tone you can infer some conclusions
You have received a lot of similar inputs. Here is one that has a slightly different take that may be helpful in your thought process:
Consider the real part as a cosine wave. Then the imaginary part would correspond to a sine wave. With reference to the calculus, the imaginary part can be viewed as the rate of change of the real part. Of course, cosine^2 + sine^2 = 1 for the magnitude viewpoint and the angle is jut the arctangent function.
ok. Thanks. One follow-up question. Why is that we don't usually see plots of complex value directly. For example, if the following is the complex array:
3+2j, 2+3j, 1+4j, ... then I can simply plot value (3,2) (2,3) (1,4) as a 2 dimensional plot (x,y dimensions)?
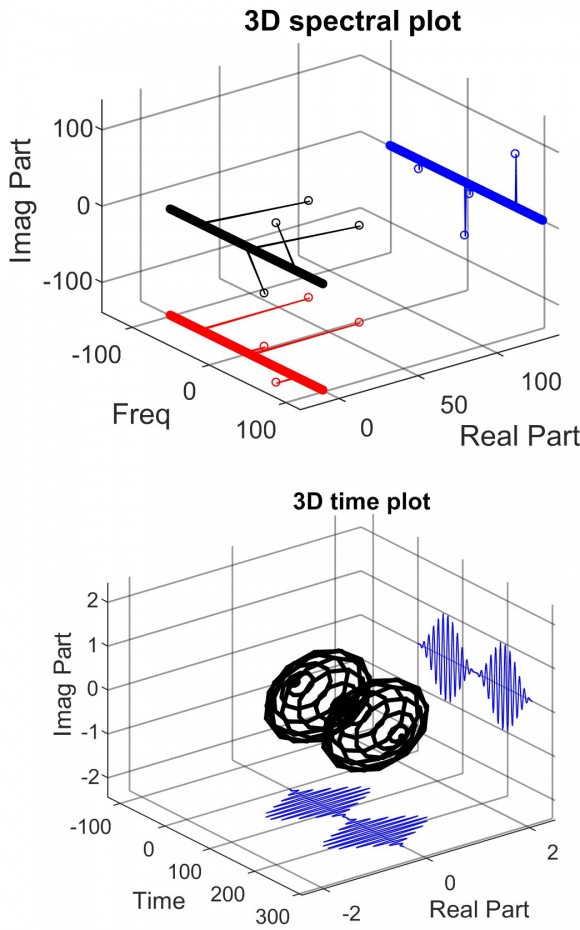
you can plot Re/Im separately or one against the other but plotting both values as pair against time requires 3D and is pointless.

There most certainly are plots of complex-valued sequences. But as kaz said, such plots must be in three dimensions. Such a plot can be found as the blue curve in Figure 4 at:
https://www.dsprelated.com/showarticle/51.php
Here are a couple of 3-D plots: