


Hello Everyone,
I am passing a signal through a RC HPF (cutoff freq = 14000 Hz). The sampling rate at which the filtered signal is acquired = 400 kS/s.
Now suppose, I don't know my input signal and only have the output signal from the output terminal of this HPF. How can I get the time domain signal which must be fed into the filter to obtain the given output signal?
For getting the PSD of the input signal, I am simply dividing the periodograms by the square of magnitude response. It works perfectly. If my input is white noise into the HPF. After dividing the Periodogram of the filtered signal, I am easily getting the periodogram of white noise i.e. flat spectrum. But I need to get the time series data which must be input to the system. How can I do this?
In short, I want to reverse the effect of the HPF to get the input time domain data.
Thanks in advance!

Hi Rahul. I think you want to perform what's called "deconvolution." And deconvolution can be performed (I) using your filter's output sequence (time-domain deconvolution) or (II) using the spectrum of your filter's output sequence (frequency-domain deconvolution).
If you have MATLAB, type "help deconv" in the Command window and then click you mouse on blue "Reference page for deconv" letters. Then you'll see the following example of time-domain deconvolution:
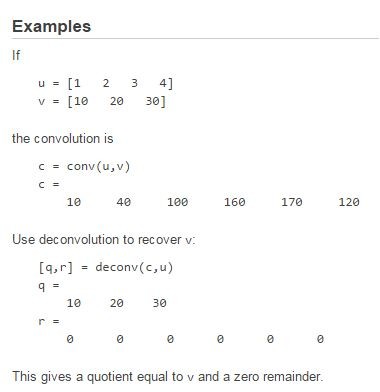
In the above example, translated to your signals, we have:
u = the time-domain impulse response of your filter (You have this.)
v = the filter's input sequence (WHAT YOU WANT!)
c = the output sequence of your filter. (You have this.)
Rahul, try out the above time-domain 'deconv()' command and let us know if it works for you. If you would like to discuss the notion of frequency-domain deconvolution, let us know.
Thanks a lot Rick!
It works perfectly and is quite intuitive way. I was not aware of the this deconv function. Thanks a lot for your suggestion. Can you also comment on the stability of this approach? Also, can you tell me why inverting the poles and zeros of the filter technique do not work as good as this technique? I guess in both methods, we are doing similar processing, we are just removing (deconvolving) the filter response from the filtered data
Just for reference to others who might have same doubt in future, here is the simple Matlab simulation code to verify this method:
clear all
close all
fs = 5000;
L = 5000;
R = 1000;
t = 0:1/fs:60-1/fs;
data = randn(length(t),1);
[pxx,freq] = pwelch(data,L,R,[],fs);
figure(1)
plot(freq,10*log10(pxx), '--');
%% filtering using butterworth filter
order =1;
fcutlow = 1000;
fcuthigh = 15915;
% [b,a] = butter(order,[fcutlow,fcuthigh]/(500000/2), 'bandpass');
[b,a] = butter(order,155/(fs/2),'high');
sig0_filt = filter(b,a,data);
[pxxf,freq1] = pwelch(sig0_filt,L,R,[],fs);
figure(2)
plot(freq1,10*log10(pxxf), '--');
%% filtering in time domain using convolution
[hh,tt] = impz(b,a);
Time_filtered = conv(data,hh);
[pxxTDHPF,freq1] = pwelch(Time_filtered,L,R,[],fs);
figure(3)
plot(freq1,10*log10(pxxTDHPF), '--');
%% Reconstruction of unfiltered data by deconvolving with filter impulse response
recons_dataa = deconv(Time_filtered,hh);
[pxxTDrecons,freq1] = pwelch(recons_dataa,L,R,[],fs);
figure(4)
plot(freq1,10*log10(pxxTDrecons), '--');
Hi Rahul. Sorry for my delayed reply. I haven't worked on any projects that required me to study deconvolution in any detail. After searching the web a little I have the distinct impression that deconvolution of noisy signals may be a bit complicated.
Also, I don't know what you meant when you wrote: "...inverting the poles and zeros of the filter technique..."

Design a filter whose transfer function is the reciprocal of the filter you have. Feed the output of your current filter to the input of this second filter. The output of the second filter will be a copy of your input signal.

you mean get LPF to filter a signal that has only power left after HPF.
Are you sure as I imagine nothing is left? and How can we recover filtered section
Rahul stated that he does not know his input signal, but he presumably knows the design of the HPF. Therefore it should be straightforward to determine the transfer function of his HPF. Therefore, a filter with a reciprocal for the HPF, which will require some active component to apply the reciprocal gain in the stop bands of the HPF, should be realizable, albeit with some delay.
well with fixed point data that is impossible in my opinion. But may be it is true for floating point.

Kaz-
I've calculated:
H(s) = Y(s)/X(s)
many times before before but to obtain reliable results I usually had to do two things (i) use 32-bit fixed-point FFT results, and (ii) average f-domain frames, maybe 3-6 or so.
Performing a similar calculation for X(s) and then finding x[n] should be a do-able thing, once you have come up with a reliable, consistent method to calculate X(s) based on your system conditions / operating parameters. As Rahul mentions, to obtain continuous, phase-coherent x[n] across f-domain frames there are other issues, but I think you are rightly worried about precision and other practical aspects, so first focusing on X(s) seems like a good idea.
-Jeff
Thanks for the reply!
Can you give me more detail about this? May be a small Matlab code or some link?
Because I guess it is not that straightforward. There will be problem at sampling frequency/2 as stated in this forum:


