


Farrow resampler
Implements a Farrow resampler in plain Matlab / Octave (no toolboxes).
Description:
A Farrow resampler reconstructs a continuous-time signals from samples using an impulse response that is approximated by piecewise polynomials. Output samples can be calculated at arbitrary time instants.
This implementation resamples a given signal to an arbitrary integer number of output samples.
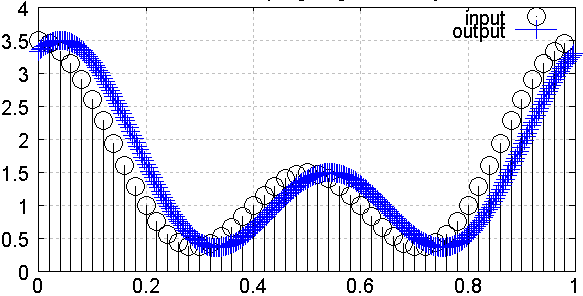
Fig.1: input signal (black) and output signal (blue)
Notes:
Regardless of the resampler implementation, one needs to be aware of the implications that come with a fractional sample rate change (namely aliasing, aliases of aliases, limitations of the resampler's frequency response, group delay, group delay ripple, to name a few).
The optional impulse test tone shows the impulse response of the resampler. By setting all but one matrix element to zero (uncomment the respective lines), the contribution of each matrix coefficient to the output signal can be visualized.
Tested on OctaveForge and Matlab.
% **************************************************************
% Vectorized Farrow resampler
% M. Nentwig, 2011
% Note: Uses cyclic signals (wraps around)
% **************************************************************
close all; clear all;

% inData contains input to the resampling process (instead of function arguments)
inData = struct();

% **************************************************************
% example coefficients.
% Each column [c0; c1; c2; c3] describes a polynomial for one tap coefficent in fractional time ft [0, 1]:
% tapCoeff = c0 + c1 * ft + c2 * ft ^ 2 + c3 * ft ^ 3
% Each column corresponds to one tap.
% the matrix size may be changed arbitrarily.
%
% The example filter is based on a 6th order Chebyshev Laplace-domain prototype.
% **************************************************************
inData.cMatrix =[ -8.57738278e-3 7.82989032e-1 7.19303539e+000 6.90955718e+000 -2.62377450e+000 -6.85327127e-1 1.44681608e+000 -8.79147907e-1 7.82633997e-2 1.91318985e-1 -1.88573400e-1 6.91790782e-2 3.07723786e-3 -6.74800912e-3
 2.32448021e-1 2.52624309e+000 7.67543936e+000 -8.83951796e+000 -5.49838636e+000 6.07298348e+000 -2.16053205e+000 -7.59142947e-1 1.41269409e+000 -8.17735712e-1 1.98119464e-1 9.15904145e-2 -9.18092030e-2 2.74136108e-2
 -1.14183319e+000 6.86126458e+000 -6.86015957e+000 -6.35135894e+000 1.10745051e+001 -3.34847578e+000 -2.22405694e+000 3.14374725e+000 -1.68249886e+000 2.54083065e-1 3.22275037e-1 -3.04794927e-1 1.29393976e-1 -3.32026332e-2
 1.67363115e+000 -2.93090391e+000 -1.13549165e+000 5.65274939e+000 -3.60291782e+000 -6.20715544e-1 2.06619782e+000 -1.42159644e+000 3.75075865e-1 1.88433333e-1 -2.64135123e-1 1.47117661e-1 -4.71871047e-2 1.24921920e-2
] / 12.28;

% **************************************************************
% Create example signal
% **************************************************************
nIn = 50; % used for test signal generation only
if true
    % complex signal
    inData.signal = cos(2*pi*(0:(nIn-1)) / nIn) + cos(2*2*pi*(0:(nIn-1)) / nIn) + 1.5;
else
    % impulse response
    inData.signal = zeros(1, nIn); inData.signal(1) = 1; %

    % inData.cMatrix = 0 * inData.cMatrix; inData.cMatrix(1, 1) = 1; % enable to show constant c in first tap
    % inData.cMatrix = 0 * inData.cMatrix; inData.cMatrix(2, 1) = 1; % enable to show linear c in first tap
    % inData.cMatrix = 0 * inData.cMatrix; inData.cMatrix(3, 1) = 1; % enable to show quadratic c in first tap
    % inData.cMatrix = 0 * inData.cMatrix; inData.cMatrix(1, 2) = 1; % enable to show constant c in second tap
end

% **************************************************************
% Resample to the following number of output samples
% must be integer, otherwise arbitrary
% **************************************************************
inData.nSamplesOut = floor(nIn * 6.28);

% **************************************************************
% Set up Farrow resampling
% **************************************************************
nSamplesIn = size(inData.signal, 2);
nSamplesOut = inData.nSamplesOut;
order = size(inData.cMatrix, 1) - 1; % polynomial order
nTaps = size(inData.cMatrix, 2); % number of input samples that contribute to one output sample (FIR size)

% pointer to the position in the input stream for each output sample (row vector, real numbers), starting at 0
inputIndex = (0:nSamplesOut-1) / nSamplesOut * nSamplesIn;

% split into integer part (0..nSamplesIn - 1) ...
inputIndexIntegerPart = floor(inputIndex);
% ... and fractional part [0, 1[
inputIndexFractionalPart = inputIndex - inputIndexIntegerPart;

% **************************************************************
% Calculate output stream
% First constant term (conventional FIR), then linear, quadratic, cubic, ...
% **************************************************************
outStream = zeros(1, inData.nSamplesOut);
for ixOrder = 0 : order
    x = inputIndexFractionalPart .^ ixOrder;

    % **************************************************************
    % Add the contribution of each tap one-by-one
    % **************************************************************
    for ixTap = 0 : nTaps - 1
        c = inData.cMatrix(ixOrder+1, ixTap+1);
        % index of input sample that contributes to output via the current tap
        % higher tap index => longer delay => older input sample => smaller data index
        dataIx = inputIndexIntegerPart - ixTap;
        % wrap around
        dataIx = mod(dataIx, nSamplesIn);
        % array indexing starts at 1
        dataIx = dataIx + 1;
        delayed = inData.signal(dataIx);
        % for each individual output sample (index in row vector),
        % - evaluate f = c(order, tapindex) * fracPart .^ order
        % - scale the delayed input sample with f
        % - accumulate the contribution of all taps
        % this implementation performs the operation for all output samples in parallel (row vector)
        outStream = outStream + c * delayed .* x;
    end % for ixTap
end % for ixOrder

% **************************************************************
% plot
% **************************************************************
xIn = linspace(0, 1, nSamplesIn + 1); xIn = xIn(1:end-1);
xOut = linspace(0, 1, nSamplesOut + 1); xOut = xOut(1:end-1);

figure(); grid on; hold on;
stem(xIn, inData.signal, 'k+-');
plot(xOut, outStream, 'b+-');
legend('input', 'output');
title('Farrow resampling. Signals are cyclic');


