


(So far, 63 people got it right out of 260 for a success rate of 24%)
(Thank you to @apolin for submitting this quiz question.)
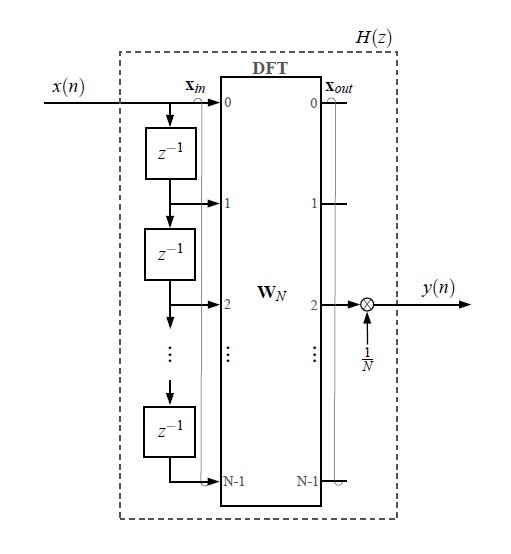
A sequence x(n) is parallelized with a delay line, as indicated in the following figure, forming a vector given as
$$ x_{in} = [x(n)x(n-1) \dots x(n-N+1)]^T. $$
We assume N = 8 and compute an N-point DFT of this vector, $ x_{out} = W_Nx_{in} $, where $ W_N $ is the DFT matrix (and yes, you could use any FFT implementation). From this vector, computed at each sampling interval, we take the third element, divide it by N and make it the output of an FIR digital filter which system function is represented by H(z). Of course, you could express the coefficient vector of the resulting FIR filter as the third row of the DFT matrix (divided by N).
Quiz question: assuming a certain sampling frequency, $ f_s = 8kHz $, how would you characterize the frequency response of this linear and time-invariant system?
- Comments
- Write a Comment Select to add a comment
Great question! I'll admit I got this wrong because I didn't pick-up on the reversed direction of the data - which I should know better because I have some experience with polyphase channelizers (so no excuse for me). I thought I'd point out some other interesting properties of this arrangement.
1.) You can think of this example as a sliding window, where the FFT slides along the data and recomputes the entire N-length transform each time a new data sample arrives. So, the FFT output rate is N times the data input rate.
2.) So, the sample rate of the output channel is the same as the input, and unless you want a lot of over sampling, the output is quite oversampled. Decimating the output seems like a desirable thing, but, it will result in aliasing in all the side bands which is not likely desirable. If you want to see how much, plot the output using 20*log10(abs(fftshift(H))) to see how limited the filter band rejection is. Which leads to...
3.) The filter is simply a sinc function, and is the result of the rectangular window used to select the N=8 samples for the FFT. So the passband is not very flat, and the adjacent bands are only -13 dB down.
4.) The output plot essentially shows the magnitude of the FFT leakage swept out over the input bandwidth (which is Fs for complex valued data), again a direct result of the rectangular window. This is actually a very instructive point that I liked a lot about this example.
So, as FIR filters go, it is limited. This is why the more computationally efficient and better performing (filter performance) implementations use polyphase filters to build channelizers. But, I loved this as an example to think about the various implications of delay lines and FFT's
Thanks for posting it!
I'll post the MATLAB code that shows what I mean about the sinc function:
% from your line 20 onward...
X = abs(fftshift(H));
figure
plot((fs/2)*(w-pi)/(1000*pi),X,'k','linewidth',3)
xlabel('fkHz'); ylabel('Hf'); grid
% In dB
figure
nn = (fs/2)*(w-pi)/(1000*pi);
plot(nn,20*log10(X),'k','linewidth',3)
xlabel('fkHz'); ylabel('Hf (dB)'); grid
axis([min(nn), max(nn), -50, 0])
grid on
% Notice that the filter is the sinc fucntion and is the leakage assoicated
% with the rectangular window (the length of the transform N=8)
t = linspace(-5,5);
y = sinc(t);
figure
plot(t,y);
grid on
xlabel('Time (sec)');ylabel('Amplitude'); title('Sinc Function')
% In dB
figure
plot(t,20*log10(y));
axis([min(t), max(t), -50, 0])
grid on
xlabel('Time (sec)');ylabel('Amplitude (dB)'); title('Sinc Function')
I haven't been able to write comments here for a long time, let's see if that has changed today...

Hi. I think the first possible answer,
"A (narrowband) analytic bandpass filter centered in ω=π/2 or, equivalently, in f=2kHz.",
is the correct answer. See the blog at:
https://www.dsprelated.com/showarticle/187.php

Hi Rick, thank you for your message.
I believe the tricky part of this question is the way the delay line enters the FFT.
Note that in https://www.dsprelated.com/showarticle/187.php, Figure 2, the first point of the DFT (the one multiplied by "1" or exp(-j 2 pi 0 m/N)) is u(n-N+1), an earlier input. And the mth bin of the DFT is computed.
In my figure, the first element of the input vector is the latest input, x(n), and in this case, it happens what is described in the explanation.
The two figures are almost identical but the DFT input (in this DSP Quiz Question) is in the reversed order.
Correct answer is then -2kHz. Please run the Matlab code provided to double check it.
Best regards,
Jose.
Hi.
Oh my. You are correct. My mistake. Sorry for the confusion apolin!
To post reply to a comment, click on the 'reply' button attached to each comment. To post a new comment (not a reply to a comment) check out the 'Write a Comment' tab at the top of the comments.
Please login (on the right) if you already have an account on this platform.
Otherwise, please use this form to register (free) an join one of the largest online community for Electrical/Embedded/DSP/FPGA/ML engineers:


