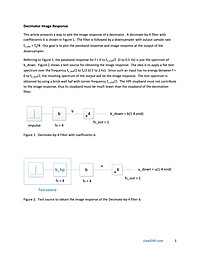
Decimator Image Response
This article presents a way to compute and plot the image response of a decimator. I'm defining the image response as the unwanted spectrum of the impulse response after downsampling, relative to the desired passband response.
Summary
This article shows how to compute and visualize the image response produced by a decimator, defining the image response as the unwanted spectral components of the impulse response after downsampling compared to the desired passband. It walks through practical computation and plotting methods so readers can quantify and interpret aliasing and image levels for decimation filter design.
Key Takeaways
- Compute the decimator image response using time-domain impulse responses and frequency-domain FFT analysis.
- Plot image spectra aligned with the desired passband to visually separate wanted and unwanted components.
- Quantify aliasing and image levels to derive practical stopband/transition requirements for decimation filters.
- Adjust or design FIR decimation filters (including polyphase implementations) to suppress image responses to acceptable levels.
Who Should Read This
DSP engineers or researchers working on multirate systems and filter design who want practical methods to compute, plot, and evaluate decimator image spectra.
TimelessIntermediate
Related Documents
- A Quadrature Signals Tutorial: Complex, But Not Complicated TimelessIntermediate
- Lecture Notes on Elliptic Filter Design TimelessAdvanced
- Computing FFT Twiddle Factors TimelessAdvanced
- Digital Envelope Detection: The Good, the Bad, and the Ugly TimelessIntermediate
- The World's Most Interesting FIR Filter Equation: Why FIR Filters Can Be Line... TimelessAdvanced


