A DSP Quiz Question
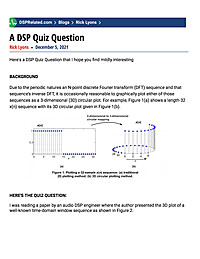
Here's a DSP Quiz Question that I hope you find mildly interestingBACKGROUNDDue to the periodic natures an N-point discrete Fourier transform (DFT) sequence and that sequence’s inverse DFT, it is occasionally reasonable to graphically plot...
Summary
This blog presents a short DSP quiz that uses the periodic nature of the N-point DFT and its inverse to illustrate common spectral-analysis pitfalls and visualization tricks. Readers will see practical examples and graphical reasoning that clarify DFT periodicity, aliasing, and plotting conventions.
Key Takeaways
- Identify how N-point DFT periodicity affects time- and frequency-domain plots and interpretation.
- Distinguish circular convolution from linear convolution and recognize when aliasing will appear in DFT-based plots.
- Visualize how zero-padding and sample alignment change spectral interpolation and bin placement.
- Apply simple plotting conventions to avoid misreading inverse-DFT reconstructions and spectra.
Who Should Read This
Intermediate DSP engineers, graduate students, and practitioners in communications or audio who want a quick, practical refresher on DFT periodicity, plotting, and common spectral pitfalls.
Still RelevantIntermediate
Related Documents
- A New Approach to Linear Filtering and Prediction Problems TimelessAdvanced
- A Quadrature Signals Tutorial: Complex, But Not Complicated TimelessIntermediate
- An Introduction To Compressive Sampling TimelessIntermediate
- Lecture Notes on Elliptic Filter Design TimelessAdvanced
- Computing FFT Twiddle Factors TimelessAdvanced


