David Valencia ● January 31, 2011
● Coded in
Matlab This program can compute an approximate function to one the user describes in terms of t, and plots both functions to see the differences between them.
A simple example:
The command window looks like:
### FOURIER TRIGONOMETRICAL SERIES###
Specify the range (t1,t2) for the approximation:
t1= 0
t2= 10
Is there a repeating patterin in this range? (Y/N): N
The approximation will be generated in a trigonometrical series:
f(t)=a0+a1*cos(omega0*t)+a2*cos(2*omega0*t)+...+b1*sen(omega0*t)+b2*sen(2*omega0*t)
Until what coefficient ak,bk should I compute? (positive integer) n= 5
Is the function defined by parts? (Y/N): N
Write the function in terms of t
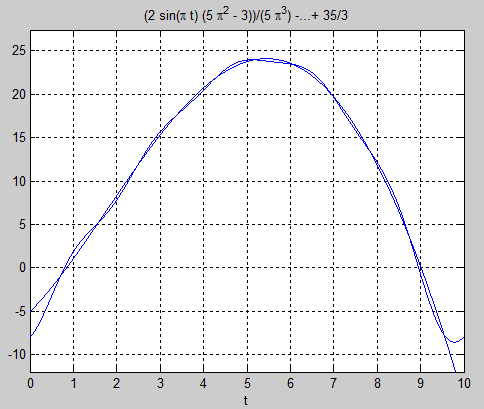
f(t)= 5*t+1.4*t^2-0.3*t^3+0.01*t^4-5
The resulting coeficcients are:
a0 =
35/3
a =
[ -(10*(11*pi^2 + 30))/pi^4, -(5*(22*pi^2 + 15))/(4*pi^4), -(10*(33*pi^2 + 10))/(27*pi^4), -(5*(88*pi^2 + 15))/(64*pi^4), -(2*(55*pi^2 + 6))/(25*pi^4)]
b =
[ (10*(pi^2 - 15))/pi^3, (5*(4*pi^2 - 15))/(4*pi^3), (10*(3*pi^2 - 5))/(9*pi^3), (5*(16*pi^2 - 15))/(32*pi^3), (2*(5*pi^2 - 3))/(5*pi^3)]
Do you wish to plot the graph of f(t) against the approximate series? (Y/N): Y
END OF PROGRAM>
%Trigonometric Fourier Series Approximation
%José David Valencia Pesqueira - UPIITA-IPN
%As posted for Dsprelated.com

close all; clear all; clc;
syms t k;

fprintf('\n ### FOURIER TRIGONOMETRICAL SERIES###');

fprintf('\nSpecify the range (t1,t2) for the approximation:\n');
t1=input('t1= ');
t2=input('t2= ');

% Getting the period

fprintf('\nIs there a repeating patterin in this range? (Y/N): ');
resp1=input('','s');

switch resp1
    case 'Y'
        fprintf('\nWhat is the period for the function?\n');
        T=input('T= ');
        omega0=(2*pi)/T;
    case 'N'
        T=t2-t1;
        omega0=(2*pi)/T;
    otherwise
        fprintf('\nInvalid Option');
        fprintf('\nEnd of program>>>');
        return
end

fprintf('\nThe approximation will be generated in a trigonometrical series: \n\n');
fprintf('f(t)=a0+a1*cos(omega0*t)+a2*cos(2*omega0*t)+...+b1*sen(omega0*t)+b2*sen(2*omega0*t)');

fprintf('\n\nUntil what coefficient ak,bk should I compute? (positive integer) n= ');
n=input('');
if n<=0
    fprintf('Invalid n');
    fprintf('\nProgram Stop >>>');
    return
end

fprintf('\nIs the function defined by parts? (Y/N): ');
resp1=input('','s');

switch resp1
    case 'N'
        fprintf('\nWrite the function in terms of t\nf(t)= ');
        f=input('');

        faprox=0;

        a0=(1/T)*int(f,t,t1,(t1+T));

        faprox=a0;

        for k=1:n
            a(k)=(2/T)*int((f*cos(k*omega0*t)),t,t1,(t1+T));
            faprox=faprox+a(k)*cos(k*omega0*t);
        end

        for k=1:n
            b(k)=(2/T)*int((f*sin(k*omega0*t)),t,t1,(t1+T));
            faprox=faprox+b(k)*sin(k*omega0*t);
        end

    % If the function is defined in many parts
    case 'Y'
        fprintf('\nHow many ranges do you want to define (positive integer): ');
        numinterv=input('');
        numinterv=round(numinterv);
        for k=1:numinterv
            fprintf('\n## Range #%d definition',k);
            fprintf('\n Write the range in the form of t(%d)<t<t(%d) : ',k-1,k);
            fprintf('\nt(%d)= ',k-1);
            a(k,1)=input(''); %Initial limits vector
            fprintf('\nt(%d)= ',k);
            a(k,2)=input(''); %Final limit vector
            fprintf('\nThe range # %d has a start in %d and ends in %d',k,a(k),a(k+1));
            fprintf('\nPlease define f(t) for the %d th interval:\nf(t)= ',k);
            ft(k)=input('');
            fprintf('\nEnd of definition of the function f%d',k);
        end

        faprox=0;
        a0=0
        for j=1:numinterv
            a0=a0+(1/T)*int(ft(j),t,a(j,1),a(j,2));
        end

        faprox=a0;

        % ak coefficient
        ak=0;
        for j=1:numinterv
            acumulador=(2/T)*int((f(j)*cos(k*omega0*t)),t,a(j,1),a(j,2));
            ak=ak+acumulador;
        end

        return

        fprintf('\n## End of Debug Execution');
        return
    otherwise
        fprintf('\nEND OF PROGRAM>>');
        return
end

%% Salida de datos
fprintf('\nThe resulting coeficcients are: ');
a0
a
b

fprintf('\n Do you wish to plot the graph of f(t) against the approximate series? (Y/N): ');
resp1=input('','s');

if resp1=='Y'
    ezplot(f,[t1,t2]);
    hold on
    ezplot(faprox,[t1,t2]);
    grid;
end

fprintf('\nEND OF PROGRAM');


