DSPRelated.com
Blogs

A Simple Complex Down-conversion Scheme

Rick LyonsJanuary 21, 20087 comments
Recently I was experimenting with complex down-conversion schemes. That is, generating an analytic (complex) version, centered at zero Hz, of a real bandpass signal that was originally centered at ±fs/4 (one fourth the sample rate). I managed to obtain one such scheme that is computationally efficient, and it might be of some mild interest to you guys. The simple complex down-conversion scheme is shown in Figure 1(a).

It works like this: say we have a real xR(n) input bandpass signal having the spectrum shown in Figure 1(b), and for our example the sample rate is fs = 24 kHz. The Delay/Hilbert transform filter combination in Figure 1(a) attenuates the negative frequency spectral components of XR(f) to produce the complex uI(n) + juQ(n) signal whose spectrum is provided in Figure 1(c). (The first Delay function in the top path is a cascade of unit delay elements, whose length is the group delay of the Hilbert filter, needed to time-synchronize the uI(n) and uQ(n) sequences.) The follow-on downsample by four (discard all but every fourth sample) performs our desired frequency translation and produces the complex v(m) sequence having the spectrum shown in Figure 1(d) where the new sample rate is 6 kHz.
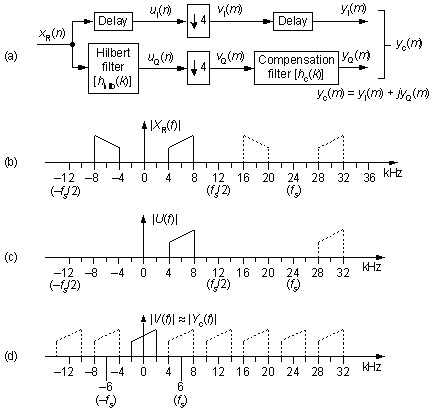
 

Down Conversion Scheme, Figure 1

Figure 1

The compensation filter in Figure 1(a) is used to compensate for the non-flat frequency magnitude response of the Hilbert filter in order to widen the down-converter's usable passband width. (The Delay function after the downsampling in the top path is needed to time-synchronize the yI(m) and yQ(m) sequences.) To make this complex down-converter computationally efficient, I suggest the implementation shown in Figure 2, where the compensation filter's coefficients are hc(0) = -1/32, and hc(1) = 1/2 + 1/16.
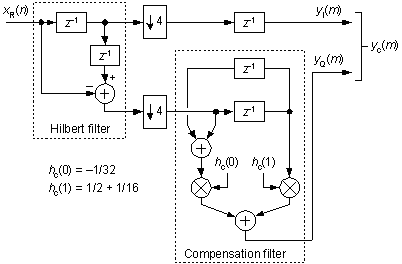
 

Down Conversion Scheme, Figure 2

Figure 2

If the xR(n) input signal's bandwidth is no greater than fs/6, then Figure 2's Hilbert filter attenuates xR(n)'s undesired negative-frequency spectral components, at the yc(n) output, by approximately 35 dB. That much attenuation may not be something to write home about, but keep in mind that this down-converter requires no multipliers because the multiplies by the hc(0) and hc(1) coefficients can be implemented with binary shifts and adds. Now at the expensive of two multiplies per output sample, the compensation filter coefficients can be set to hc(0) = -0.02148 and hc(1) = 0.54128 to attenuate xR(n)'s undesired negative-frequency spectral components by roughly 45 dB.

Again, I thought some readers might find this little downconversion scheme to be interesting. If you have any questions, or comments, please let me know.


Copyright © 2008, Richard Lyons, All Rights Reserved


[ - ]
Comment by DSmithJanuary 23, 2008
Rick, Always enjoy your posts/tips/tricks. I have a question about the performance of the Hilbert filter shown in figure 2. Prior to the decimation, I believe the Hilbert filter can be represented as a complex-valued filter with impulse response h=[0 1 0]+j*[-1 0 1] In Matlab, the frequency response I get using freqz([0 1 0]+j*[-1 0 1],1,1024,'whole',24000) gives rejection of ~10 dB for the 16-to-20 kHz sideband. How does the compensation filter after decimation improve the rejection to 35 or 45 dB? thanks, Dale
[ - ]
Comment by Rick LyonsJanuary 25, 2008
Hello Dale, Sorry for the delayed reply. (I've been a bit busy.) You are correct about the performance of that super-simple Hilbert transformer. The unequal gain of the real and imaginary paths of that HT makes for poor negative-frequency attenuation. Because of the downsampling by four, I wasn't sure my normal (freqz, imp. response/FFT) methods for measuring the performance of the two cascaded filters would be valid. So I merely modeled the down-conversion network, and applied swept-frequency real-valued sinewaves to the network's input. Then I measured the attenuation of the negative- frequency spectral component, in the network's complex-valued output, relative to the positive- frequency spec component. You post made me "double-check" my modeling, and I believe it's correct. But shoot. As you know Dale, double-checking one's own work is unreliable. What would be nice is if you could model the network, apply a real-valued sine wave to the input (whose freq is very near Fs/4), and measure the attenuation of the negative- frequency spectral component, in the network's complex-valued output, relative to the positive- frequency spec component. If you see a neg-freq spectral component attenuation of around 35 dB (relative to the pos-freq spec component), then our modeling is probably correct. I'd sure be tickled to learn your modeling results. Best Regards, [-Rick-]
[ - ]
Comment by DSmithJanuary 27, 2008
I ran a quick Matlab sim and it seems to validate the ~10 dB number (sim attached below). Let me know if you catch any errors that I have introduced. My intuition is as follows: the decimation operation will cause the 4-8 kHz band and the 16-20 Khz bands to fall on top of each other, but they will be spectrally flipped with respect to each other (16 KHz falls onto 4 Khz and 20 KHz falls on top of the 8 KHz). Any linear filter following decimation will not help the negative frequency rejection as the two components are on top of each other in the same frequency band. For example, in the 4-sinewave example below, at the output (figure 4) you can see the positive frequency components show up at at 50, 150, 5800 and 5900 Hz respectively while the attenuated negative frequency components show up at 100, 200, 5850, and 5950 Hz. There is not too much difference between figure 3 (before compensation) and figure 4 (after compensation). regards, Dale Fs = 24000; sine_freqs = [5800 5900 6050 6150]; num_samples = 2^16; tt = 0:num_samples-1; xr=0; for kk=1:length(sine_freqs) xr = xr+cos(2*pi*sine_freqs(kk)/Fs*tt); end figure(1) psd(xr,4096,Fs); %plot(tt/num_samples*Fs,20*log10(abs(fft(xr,num_samples)))) xlabel('Frequency') title('Input signal (Xr)') grid on xcomplex = filter([0 1 0]+j*[-1 0 1],1,xr); figure(2) psd(xcomplex,4096,Fs); %plot(tt/num_samples*Fs,20*log10(abs(fft(xcomplex,num_samples)))) xlabel('Frequency') title('Complex signal (UI+j*UQ)') grid on xdecimated = xcomplex(1:4:end); tt2 = 0:length(xdecimated)-1; num_samples2 = length(tt2); figure(3) psd(xdecimated,4096,Fs/4); %plot(tt2/num_samples2*(Fs/4),20*log10(abs(fft(xdecimated,num_samples2)))) xlabel('Frequency') title('Decimated signal (VI+j*VQ)') grid on xcompensated = filter([0 1 0]+j*[-1/32 9/16 -1/32],1,xdecimated); figure(4) psd(xcompensated,4096,Fs/4); %plot(tt2/num_samples2*(Fs/4),20*log10(abs(fft(xcompensated,num_samples2)))) xlabel('Frequency') title('Output signal (YI+j*YQ)') grid on
[ - ]
Comment by DSmithJanuary 27, 2008
I keep thinking about this problem... One method I thought of was to design a Hilbert filter with several zeros at z = -j. Stacking a few on top of each other results in simple filters with pretty good rejection for relatively narrowband input signals. For instance, a filter with four zeros on top of each other (1+j*z^-1)^4 results in a filter complex impulse response of [1 0 -6 0 1]+j*[0 4 0 -4 0] which can be implemented multiplierless (the +/-4 are bit shifts and -6 can be implemented as (-4)+(-2) which are also bit shifts). It gives about 45 dB of rejection for signals narrower than Fs/6 at the expense of ~1.2 dB of passband ripple (which could be cleaned up with a compensation filter much like your example). I suppose this design is a relative of a real-valued CIC filter (1+z^-1)^N Dale
[ - ]
Comment by ops_alineApril 24, 2021

I am a bit delayed hehehe.

But, would you mind giving me the compensation filter for the scheme  you have proposed above?

Thanks,

Aline

[ - ]
Comment by Rick LyonsApril 25, 2021

Hello ops_aline. To describe Figure 2's compensation filter in more detail; first, it's a tapped-delay line FIR filter having two delay elements and three coefficients. The delay line in Figure 2 is "folded" to reduce the number of necessary arithmetic operations per input sample. In its most efficient implementation the three coefficients are -1/32, 1/2+1/16, -1/32 allowing multiplication to be implemented with binary right shifts and additions. In this case the down-converter is multiplier-free.

For improved attenuation of the unwanted negative-frequency spectral components, the three coefficients can be -0.02148, 0.54128, -0.02148. (In which case the the down-converter is no longer multiplier-free.)

[ - ]
Comment by Rick LyonsJanuary 27, 2008
Hi Dale, I just received a notice of your 2nd (not your 1st) 1/28/08 "Comment". Early tomorrow morning I'm takin' off for a week-long business trip. So I can't, right now, put in any effort regarding your two 1/28/08 posts. Dale, will you please send me an E-mail so that I have your E-mail address. My E-mail address is: R.Lyons@_BOGUS_ieee.org. (Remove the characters before the ieee.) Regards, [-Rick-]

To post reply to a comment, click on the 'reply' button attached to each comment. To post a new comment (not a reply to a comment) check out the 'Write a Comment' tab at the top of the comments.

Please login (on the right) if you already have an account on this platform.

Otherwise, please use this form to register (free) an join one of the largest online community for Electrical/Embedded/DSP/FPGA/ML engineers: