


Handy Online Simulation Tool Models Aliasing With Lowpass and Bandpass Sampling
Analog Devices
Inc. has posted a neat software simulation tool on their corporate web site
that graphically shows the aliasing effects of both lowpass and bandpass periodic
sampling. This is a nice tutorial tool for beginners in DSP.
The tool shows four important characteristics of periodic sampling:
| Characteristic# 1: | All input analog spectral components, regardless of their center frequencies, show up (appear) below half the sample rate in the digitized signal's spectrum. | ||
| Characteristic# 2: | The frequency-translation effects of bandpass sampling. | ||
| Characteristic# 3: | Harmonics of a fundamental analog bandpass signal have increased bandwidths relative to the bandwidth of the fundamental bandpass signal. | ||
| Characteristic# 4: | Aliased harmonics of a fundamental analog bandpass signal can fold back and interfere with the non-aliased fundamental bandpass signal. |
Below I show how to demonstrate those important characteristics.
The Analog Devices Inc. periodic sampling simulation tool, called the "Frequency Folding Tool" can be accessed at:
Demonstrating Characteristic# 1
In the 'Frequency Folding Tool' we can demonstrate Characteristic# 1 by performing the following steps:
| [1] | Enter the following parameter values in their appropriate cells: | |||
| Sampling Frequency: 1000 MHz Fundamental Frequency: 100 MHz |
||||
| Hit your keyboard's 'Enter' key after typing a number in a parameter's cell. | ||||
| [2] | Click 'Single Tone' button | |||
| [3] | Enter the following 'Harmonic Amplitudes' values in their appropriate cells: | |||
| Fundamental: -10 dB 2nd Harmonic: -40 dB 3rd Harmonic: -50 dB |
||||
| [4] | Click the "Nyquist Zones" number 6 box. (The light-blue shaded regions are the 2nd, 4th, and 6th Nyquist frequency zones.) | |||
| The tool's window should now look like Figure 1 below. | ||||
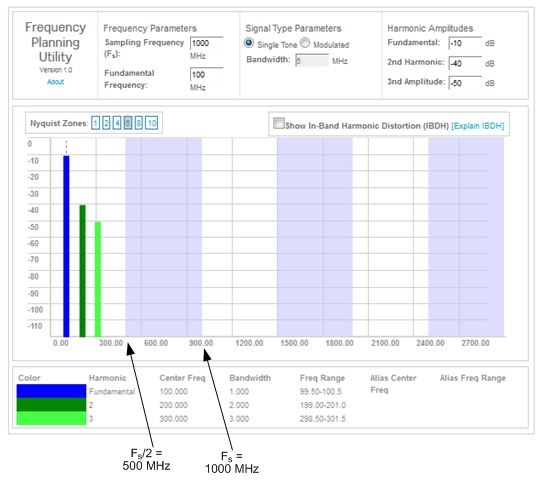
Figure 1
| [5] | Move the tool's default cursor over the dark blue 'fundamental' vertical bar until the cursor changes to a four-headed arrow. Hold down your mouse button and VERY slowly drag the blue bar to the right. | ||
| [6] | Notice: no matter where the three analog input tones are spectrally located, after periodic sampling the fundamental and harmonic spectral components are always located below Fs/2 (500 MHz) in the 1st Nyquist zone. (Spectrally aliased tones are marked with the letter 'A'.) | ||
The center frequencies of the aliased spectral components are listed under the "Alias Center Freq" column at the bottom of the tool's window.
Demonstrating Characteristic# 2
We can demonstrate the spectral translation effects of bandpass sampling by performing the following steps:
| [1] | Enter the following in the 'Fundamental Frequency' cell: | |||
| Fundamental Frequency: 100 MHz | ||||
| [2] | Click 'Modulated' button | |||
| [3] | Enter the following in the 'Bandwidth' cell: | |||
| Bandwidth: 100 MHz | ||||
| [4] | Enter the following 'Harmonic Amplitudes' values in their appropriate cells: | |||
| 2nd Harmonic: -200 dB 3rd Harmonic: -200 dB |
||||
| The tool's window should now look like Figure 2 below. | ||||
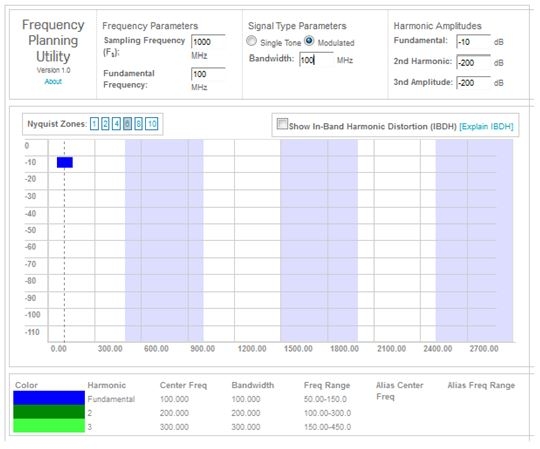
Figure 2
| [5] | Move the tool's default cursor over the dark blue 'fundamental' horizontal bar until the cursor changes to a four-headed arrow. Hold down your mouse button and very slowly drag the blue horizontal bar to the right. | ||
| [6] | Notice: the bandpass signal always aliases down in frequency to reside below F s/2 (500 MHz) in the 1st Nyquist zone. | ||
Demonstrating Characteristic# 3 and 4
We can demonstrate Characteristics# 3 and 4 by performing the following steps:
| [1] | Enter the following in the 'Fundamental Frequency' cell: | |||
| Fundamental Frequency: 100 MHz | ||||
| [2] | Enter the following in the 'Bandwidth' cell: | |||
| Bandwidth: 50 MHz | ||||
| [3] | Enter the following 'Harmonic Amplitudes' values in their appropriate cells: | |||
| 2nd Harmonic: -40 dB 3rd Harmonic: -50 dB |
||||
| [4] | Click the "Nyquist Zones" number 2 box. | |||
| The tool's window should now look like Figure 3 below. | ||||
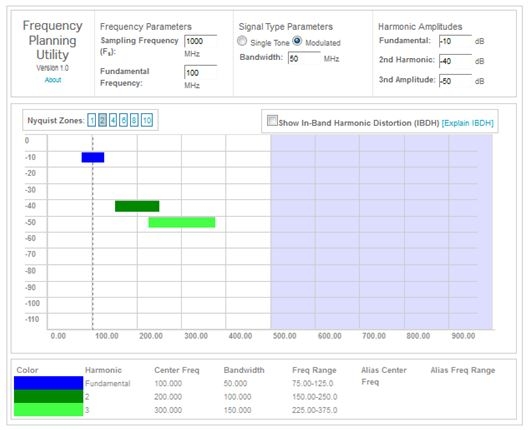
Figure 3
| Notice: the increased bandwidths (100 and 150 MHz) of the 2nd and 3rd bandpass harmonics. | ||||
| [5] | Click the "Show In-Band Harmonic Distortion (IBDH)" box. | |||
| Notice: the "IBHD:" In-Band Harmonic Distortion estimation shows a numerical decibel value of '–Infinity dB'. | ||||
| [6] | Move the tool's default cursor over the dark blue 'fundamental' horizontal bar until the cursor changes to a four-headed arrow. Hold down your mouse button and very slowly drag the blue horizontal bar to the right. | |||
| [7] | Notice: when the 'Fundamental Frequency' exceeds 225 MHz the aliased 3rd harmonic bandpass signal interferes (shares the same frequency band) with the dark blue non-aliased fundamental bandpass signal. | |||
The 'Frequency Folding Tool' is a useful tutorial tool for modeling the effects of periodic sampling.
My only complaint with the tool is that the center frequency value of the aliased 'Fundamental' spectral component listed under the "Alias Center Freq" column at the bottom of the tool's window is obscured by that column's label.

- Comments
- Write a Comment Select to add a comment
Sabine
To post reply to a comment, click on the 'reply' button attached to each comment. To post a new comment (not a reply to a comment) check out the 'Write a Comment' tab at the top of the comments.
Please login (on the right) if you already have an account on this platform.
Otherwise, please use this form to register (free) an join one of the largest online community for Electrical/Embedded/DSP/FPGA/ML engineers:


