


Confusion understanding some equations in the book "Understanding Digital Signal Processing" (Indian edition).
I am on chapter 3. On page 77 the equation approximating the amplitude response of DFT for real cosine input with k cycles over the sampled input time sequence in terms of the bin index m is given by:
X(m) = <the equation>
I am failing to understand why the notation X(m) is used. As I understand, X(m) represents a frequency domain sample (a DFT bin). But aren't we talking about amplitude here (in eqn. 3-25)?
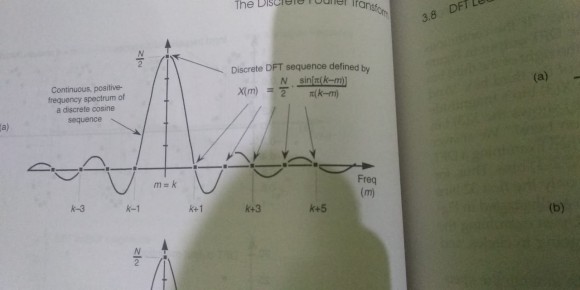
Also, in Fig (3-9.a) the horizontal axis represents bin indices (values of m) right? Then why is it labeled with Freq (it's just an index)? This figure has been bothering me for days. Would really appreciate if someone could help me understand what is being represented by the horizontal and vertical axes. Thank you.
I don't know this book, but the answers to your questions are the very heart of DSP.
When sampling an analog signal in the time domain the continuous function s(t) becomes the sequence s_n. The time index n = t / ts where ts = 1/fs. Note that the discrete time n has no units since it is time/time - it is just a pure number - an index.
At the same time the analog signal in the frequency domain is automatically converted from a continuous function S(w) to a sequence S_k where the frequency index k = w / ws = f / fs (note that k has no units since it is freq/freq, and thus it is a pure number - an index). Note also that there is no difference between f and w in the digital domain for the same reason.
So, what you call a "bin" is the index of the frequency representation in digital domain.
All clear?
Y(J)S
I don't know this book either...
But the figure is indeed confusing
The Sinc function (of m) should peak at m=k, as it does, because the cosine has k periods in the observation interval... but the labeling k=1, k=2... is confusing..
May be a more appropriate labeling of these would be m=k+1, m=k+2
Regards
This too is slightly confusing to me. The sinc function is given by the expression:
X(m) = ((AN) / 2) * (sin[pi(k-m)] / pi(k - m))
where A is the peak value of the DFT's input sinusoid. In the graph above, A is considered to be 1.
I have following questions to ask related to the graph:
a. What is being represented in the graph? Seriously, I feel so dumb to ask. It should be trivial to understand a graph by just looking, and make no mistake the book is considered a masterpiece by Richard G. Lyons for introductory DSP. I feel stupid lol. Anyways, what's represented in the vertical axis in this graph. Is this amplitude? In the description it's said that the graph represents positive-frequency response due to an N-point input sequence containing k cycles of a real cosine.
b. What is amplitude response in this context? Is this the output amplitude we get from computing the N-point DFT of a cosine?
c. When m = k, then the expression sin[pi(k-m)] results in zero, effectively making the whole thing zero (or undefined? The denominator evaluates to zero too). Then why does the sinc function results in its peak value, precisely, N/2.
Thanks!

Hello bittersweet. (I'm replying to your Dec. 6, 2020 post.)
Let's settle one thing right now. You may think you're asking a "dumb" question. Believe me, there IS NO such thing as a dumb question is the field of DSP. As an old DSP engineer told me many years ago (when I was a DSP beginner), "Asking dumb questions is how discoveries are made."
Next, I'm sorry you found my figure 3-9 puzzling. To answer your Question 'a': The Section of my book that you're reading (Section 3.8) discusses the notion of "DFT Leakage". And the phrase "DFT leakage" is used to describe the true spectrum (having infinitely-fine frequency granularity) of a finite-duration time-domain sine wave sequence. That true (theoretical) amplitude of the complex-valued spectrum is the sin(x)/x-like continuous amplitude curve in my Figure 3-9(a). The phases of the positive-amplitude spectral values in Figure 3-9(a) are zero radians. The phases of the negative-amplitude spectral values are pi radians. The magnitude of the true continuous spectrum is the curve in Figure 3-9(b).
That true spectrum (the continuous curve) of a finite-duration sine wave sequence has a "main lobe" that's preceded and followed by lower-amplitude "side lobes". And when people talk about "spectral leakage" they're talking about the sidelobes.
We cannot compute the true continuous complex-valued spectrum (the curve in Figure 3-9(a)) using a digital computer. But we can, using
X(m) = ((AN)/2)*sin[pi(k-m)]/(pi(k-m))(1)
compute the N samples of an N-point DFT of input sine wave having N time-domain samples. Now in the special case where a unity peak amplitude input sine wave has an integer 'k' number of cycles over its N time samples, the DFT amplitude samples will be the dots in my Figure 3-9(a) and the DFT magnitude samples will be the dots in my Figure 3-9(b). (I should have made the dots more prominent in Figure 3-9!).
The frequency axis labeling is meant to show, for example, if the input sine wave has k = 7 cycles over its N time samples then the spectral main lobe is located at a DFT 'm' frequency index value of m = k = 7. And the proceeding and following zero-valued DFT samples (the dots) will be located at 'm' frequency index values of 3, 4, 5, 6, 8, 9, 10, 11, and 12.
The two main points of Figure 3-9 are: (1) the infinite-granularity spectrum of a finite-duration time-domain sine wave sequence (having an integer number of cycles in N samples) is the sin(x)/x-like continuous amplitude curve in Figure 3-9(a), and (2) the dots in Figure 3-9(a) show that the DFT computes samples on that curve.
bittersweet, check out the DFT example in my Figure 3-10 that uses real numbers for when 'k' (number of input cycles) is both an integer and a non-integer value.
To answer your Question 'b': The dots in Figure 3-9 represent the results of computing an N-point DFT of an input sine wave having an integer number ('k') of cycles in N samples.
To answer your Question 'c': Yes, when the DFT's frequency index 'm' is m = k the X(m) spectral sample in the above Equation (1) evaluates to 0/0. Using L'Hopital's Rule we can evaluate Equation (1) when m = k. Doing that gives us a value of X(m) = N/2 when m = k. An example of using L'Hopital's Rule is on page 104 of your copy of my book.
I hope what I written here makes sense.
We start with the observation that a sampled data sequence has a continuous periodic Fourier transform, periodic in 2pi, that is observed on the perimeter of the unit circle. the transform is called the discrete time Fourier transform to distinguish it from the Fourier series, in which the non periodic spectrum is sampled to make the time function periodic.
When the sampled data sequence is a set on N unit valued samples, which is likened to N samples of rectangle, the spectrum is the periodic extension of the sinc function, sin(2pi fT/2)/(2pi fT/2). the periodic extension is the Dirichlet kernel, sin(phi/2)/sin(phi/(2N)). The kernel has peak amplitude N and equally spaced zero crossings at multiples of (2pi/N). When the rectangle samples are multiplied by a cosine(phi_c n) with an integer number of cycles per interval of length N, the spectrum is shifted to the center frequency (with units of rad/sample or cycles per interval f length N) and scaled by the 1/2 in Euler's expansion of the cosine.
The DFT or the algorithms that implement the DFT sample the continuous periodic spectrum at the sampled data frequencies corresponding to integer number of cycles per interval of length N. These correspond to the peak and the zero crossings of the Dirichlet kernel or the offset Dirichlet kernel when shifted to one of the multiples 2pi/N.
If you want to see other samples of the continuous kernel you would perform a larger sized transform than the number of point in the sequence. We do this by performing a transform on the zero extended sequence. For instance we can perform an 8N point DFT of an N point sequence. If we want to see the alternating sign sidelobes, rather that the magnitude of the transform, we have to place the original N point sequence symmetrically about the origin and plot the real part of the transform. Every 8-th sample in the larger DT are the samples of the original size DFT. See the example in the attached file which performs an 800 point DFT of a 100 point cosine sequence located symmetrically about the origin. When the 100 point sequence is unwrapped from the circle to be inserted in the 800 point circle, the cut of the sample at index +/-50 is appended to both left and right side of the 100 point sequence so there are in fact 101 non zero samples in the 800 point array.
hope this is useful
fred h
Thank you, mister Rick. A lot of things make sense now. And please don't be sorry. This is a fantastic book. I'm truly amazed that I had no problem grasping the content of the book so far despite having no EE background (I am a CS student) and little to no exposure to calculus. I am glad that I found your book. It's a blessing to students like us willing to learn DSP on their own.
Hello bittersweet. Thank you for your kind words.
If you are a computer science student then I have a question for you.
Question:
How many software programmers does it take to change a light bulb?
Answer:
None. It's a hardware problem.

- An optimist says “The glass is half full.”
- A pessimist says “The glass is half empty.”
- A programmer says “The glass is twice as large as necessary.”

Woodpecker-
That was a programmer's answer in the old days, when resources mattered. Now with AI and ML guys, the answer is "we built scalable glasses so don't worry about it" :-)
-Jeff
A guy asks a programmer friend : can you lend me 500$, I'm out of cash right now. He replies : I'll give you 512 to make it a nice round number
The phases of the positive-amplitude spectral values in Figure 3-9(a) is zero radians. The phases of the negative-amplitude spectral values is zero radians.
Why are the phases of both positive and negative-amplitude spectral values 0 radians ?
Hi adaptive filter. Shoot! You are correct. I have changed my Dec 6 reply's text to:
"The phases of the positive-amplitude spectral values in Figure 3-9(a)
are zero radians. The phases of the negative-amplitude spectral values
are pi radians."
Thanks for pointing that out to me.

Hi Rick,
As a side note here is my personal view on sinc function: The "fact" that it produces negative amplitude means failure of equation. We then repair it saying it is "pi" phase if negative as amplitude cannot be negative. In other words it outputs amplitude and phase polarity(not phase value) instead of separating them like does DFT equation.
Kaz
Hello
The sinc(x)=sin(x)/x goes to 1 when x goes to 0... sin(x) and x both goes to 0 but the ratio does not. When x is small sin(x) is equivalent to x-x³/6 so the sinc(x) is equivalent to (x-x³/6)/x=1-x²/6 which goes to 1...
This explains your question c. above
Reply to b. is yes
For a. may be your question should be reworded such as "what does represent the graph of a DFT ?". The DFT is a representation of the signal as a sum of sine waves. The initial signal can be recovered by the DFT information simply by summing a set of sine wave corresponding to the frequency positions with the amplitude given by the DFT at the corresponding bins.
On the specific graph you show the amplitude is zero at all bins except at bin k where it is N/2.. The graph of the Sinc at all non integer values of m are meaning less..
Regards
I have red in a DSP book a classification of the Fourier transform/series in 4 general categories, which I found useful: CTFS (continuous time Fourier series for continuous time periodic signals) CTFT (continuous time Fourier transform for continuous time aperiodic signals), DTFT (discrete time Fourier series for discrete time aperiodic signals), DFTS (discrete time Fourier series for discrete time periodic signals, known as Discrete Fourier Transform, although it would be more appropriate to call it Discrete Fourier Series). Hope some find it useful and I'm not off topic.


