


Impulse response in OFDM system using IFFT
Hi all, for my masters thesis I have acquired some measurements of the channel frequency response for 100 pilot subcarriers in a 1024 subcarrier OFDM system. Now I am looking into the power delay profile to find RMS delay spread and coherence bandwidth.
The problem I face now is that the IFFT of this channel frequency response vector of size 100 does not have the shape I expect for an impulse response (I expect a peak in the first time samples and then a sharp decline). I calculate the IFFT as follows, based on this link (slide 7):
f_c = 2.61*1e9    % carrier frequency
h_t = ifft(ifftshift(h_f)*exp(-2j*PI*f_c)
As you can see I apply a phase offset to transform the passband OFDM frequency measurement to baseband and then apply "ifftshift" to structure the frequency domain in the correct way as expected by Matlab/Python (I use Python/Numpy but this should be equivalent to Matlab).
Below I include an example of my measurement data and the resulting time domain response from IFFT.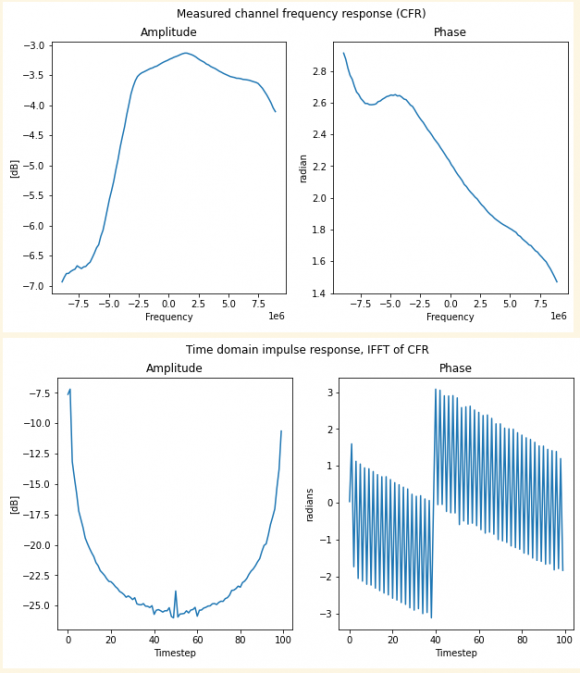
When I look at the IFFT result, the amplitude looks mirrored around the middle while the phase data is just weird. Some things I tried that did not help: interpolation of 100 pilots to all 1024 subcarriers, applying fftshift to the time domain result.
Does anybody have experience with OFDM channel measurements and can comment on the weird shape of the time domain data / my approach?

The usual way of presenting an impulse response is as plots of the real part and the imaginary part of a time sequence.
Whenever you plot a computed phase, plot it as individual dots, not as connected dots. When you plot it as connected dots, you fill in the jumps of pi and if they occur frequently, the connected dots make it look like the phase function is taking on all values. You are hiding the shape of the phase function by showing these discontinuities. In your data here, the jumps of pi occur after just about every sample. There's nothing important happening from one sample to the next - but the phase is nearly continuous from sample to sample and the jumps of multiples of 2*pi are meaningless, and the jumps of pi represent a change from an infinitesimal negative value to an infinitesimal positive value.
Hi CharlieRader, thanks for the advice! By coincidence I switched to a plot with individual dots today, exactly because the phase response is hard to read otherwise.
Can you comment on the last line "the jumps of pi represent a change from an infinitesimal negative value to an infinitesimal positive value", does this mean we should only expect jumps of pi when the phase is near 0 radians? Because in my plots it also jumps with steps of +- pi when phase is e.g. 2 radians.
Thanks, cel
Your phase response is due to misinterpretation of (angle), (angle+360), (angle-360) etc.
As for the amplitude, you should just throw away the second half of the results.
Hi, thanks for your answer!
If I understand it correctly, I should only take first N/2 (with N=100 the ifft size) samples of my complex IFFT as the time domain impulse response?
What about the time resolution then, will it become 2 times larger? I think the time resolution normally is 1/(frequency resolution), but if I only keep N/2 samples this resolution should increase to cover the same time span.

Remember that the time-domain "impulse response" determined from the frequency-domain pilot tones will be periodic, so what you'll see is one period of an estimate of essentially cyclic responses. I don't know the details of your data, but in that context it looks to me like your time-domain impulse response is one period of a cyclic response, which would be expected.

Hi, thanks for your answer josefsepp. I will try out this approach and report back. It actually sounds quite logical the factor t in the phase correction.
Update: tried out the suggested formula but I updated it to exp( -2j pi fc t / N). This has indeed changed the phase response result (see below)
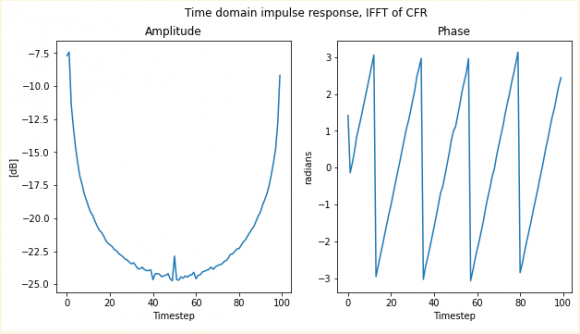
Amplitude is still mirrored / periodical.
It is not a phase correction but a multiplication with a complex oscillation. The link that is mentioned contains the same error.
You're right indeed, I have updated my comment with a result using the complex oscillation. I had to update the formula to t/N to get a visible change in the phase response. Another poster mentioned I should only use the first N/2 IFFT results, have you got any comment on that?
Anyways thanks a lot for the comment on the formula!

The plot you show, of the time domain response should also have an fftshift applied to it to bring the impulse into the middle where the new 0 delay will be.
The plot looks to me to show somewhere between 0 and one sample of delay for your new sampling rate for the 100 points.
Your new sampling rate will be defined by the distance in frequency between the pilot bins assuming that they are evenly distributed. This is the sampling rate mentioned by josefsepp, where you need to specify the length of the FFT as the effective "t".
However, I think that you need to work at your original sampling rate which you can do as follows:
You say that you have 100 pilot bins, but I think that, to get a good idea of the impulse response of the system, you need to either insert 0s in you frequency domain data for the non-pilot bins (in which case you will get repeated impulses in time, one of which will be the right one to monitor) or you need to interpolate between the pilot bins in the frequency domain (in which case you will get 1 impulse as desired). Either way you will be doing a 1024 point IFFT.
With the 1024 point IFFT you will have much finer time domain resolution, and I think that you will see the fine delay that you are looking for in the time domain.
From your original phase plot, it looks like you may have a little multi-path in your impulse response, which you will not be able to see in the low resolution 100 point time domain plot. If there is some multi-path, it will be hidden under the "exponential" skirt. It may show itself in the finer time domain case.
One more comment: Someone mentioned that you need to only keep half of the data. That would be true if the data were real (and therefore symmetric), but it is complex, so it all counts and you should not throw anything away.
Regards,
David
Hi David, thanks for the great answer!
I have implemented the interpolation before doing the IFFT again (I had already done something similar before but it didn't work out). I also added FFT shift after the IFFT. The results can be seen below.

I give here the code that I use to calculate the complex oscillation that should be multiplied with the IFFT output.
Fs = 1200 * 15000           % 1200 subcarriers with 15 kHz spacing
DELTA_T = 1 / Fs
t = 0:1200-1 * DELTA_T      % time vector
fc = 2.61*1e9               % carrier frequency of 2.61 GHz
complex_oscillation =exp(-2j* PI * fc * t/1200)
time_domain_results = ifft_output .* complex_oscillation
Since the phase response is still a bit strange I have 2 more questions for you, if you can spare the time :).
A: is it correct that the left side of the time domain plot is negative time? or should the plot start from 0 s at the origin?
B: is my definition of Fs and time resolution DELTA_T correct? I think the resolution might be wrong because it has not changed from the previous 100 point calculations.
Anyways, the resolution of the amplitude graph is indeed improved by the interpolation, so many thanks for that!
Regards
I confess that you have confused me a little.
You started with some recorded data that had a certain sample rate.
You performed an FFT of that data at some specific resolution (1024, 2048, ...).
What was that resolution?
Based on your number of active bins being 1200 at 15 kHz spacing, I have to assume you are working in the telecom space (4G LTE), so I have to assume 2048 point FFT and 30.72 MHz sampling for a 20 MHz bandwidth of which 1200 subcarriers (15 kHz) are active.
If this is true, and you are doing an IFFT, it should also be 2048 again with interpolated bins, but only interpolated over the active 1200 bin region. This will mean that your sampling rate is in fact 30.72 MHz still.
Try this out and see what happens.
Another confusion: I also have wonder how you can down modulate from a passband signal to baseband where the passband center is not some nice multiple of your baseband sampling rate? If it is a nice multiple, then the data have already been downshifted to baseband, and the demod is not necessary. (Quadrature Sampling, which results in direct baseband demod).
I don't see in your sequence, where the signal you are demodulating doesn't have some nasty potential for aliasing, as the complex exponential with carrier in the 2.61e9 range doesn't make sense when sampled at 30.72 MHz.
Apologies for any confusion caused, I am indeed working in telecom on a typical 4G LTE system (it is a massive MIMO research testbed but I'm not yet working on MIMO data). You are also correct that the data is Quadrature Sampled (I think), so in fact the entire downshifting operation has already been done.
So to retrieve the time domain impulse response from my baseband frequency response data I only need to apply the IFFT with correct number of bins and with correct time resolution to interpret the results. I think I have done this below where I applied the 2048 point IFFT on the 1200 point interpolated frequency response. Actually I applied a 2048-points IFFT to my data interpolated over 2048 equally spaced frequencies which leads to artifacts because the interpolation has to do extrapolation to frequencies outside the active spectrum.
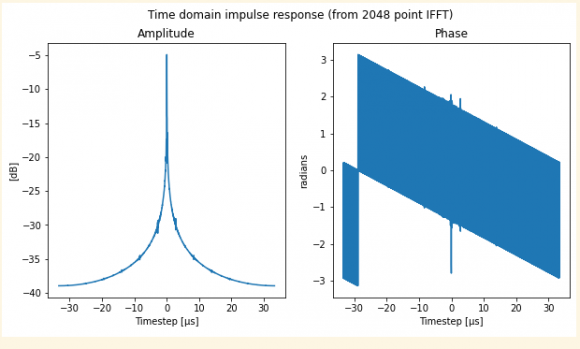
The only problem I have now is how to interpret the time domain results, the FFT shift has shifted the peak of the time response to the middle of the graph and this is confusing me. Is the power in the negative time domain maybe caused by imperfect synchronization of transmitter and receiver? I don't think it is a normal / expected part of a wireless channel impulse response?
Furthermore the phase is still oscillating between 2 separate quasi-linear responses separated by 1*Pi, I'm assuming this is some sort of artifact but I'm not sure.
Any chance of accessing your raw data? I'd be interested in running it through my IFFT algorithm to see what happens.
Hi MarkSitkowski, thanks for your interest. I have prepared some npy and csv files for you at the following WeTranfer link.
Included are raw complex channel measurements with shape of (10, 100), 10 separate measurements of 100 pilots. Each of the 10 measurements can be treated separately.
Also included is interpolated frequency domain data, the 10 measurements were interpolated linearly to 1200 subcarriers for a shape of (10,1200).
As suggested by dgshaw6, the data should be sampled at 30.72 MHz and using 2048 fft size.
Regards, Cel
Thanks! I'll play with it over the weekend. Do I assume you have (magnitude,phase in radians) with a linear frequency axis, with 10 channels concatenated in a single file?
Hi, it is real - imaginary data on linear scale. The dimension 10 is indeed for 10 different channel measurements in 1 file.
regards, cel
Cool. So the channel data is <-Ch1 100 data points-><-Ch2 100 data points-><-ch3...-> etc
Yes exactly, that is the format of the CSV file.
I split your raw data into 10 separate files, then performed an IFFT on each, and got the expected results. Here are (a) Composite frequency domain plot of all 10 channels (b) Detailed plot of the first channel in the file, and (c) IFFT of (b) which, as expected, looks like a perfectly reasonable impulse response.
Hi @MarkSitkowski , thanks for taking a look at my data. Your results indeed show me that my data should produce correct results. Do you have any information on the IFFT algorithm you used for this plot (such as fft size, zero padding method)?
Also, did you plot the entire output of the IFFT or is this only half of it? I ask because the output of my IFFT always contains 2 mirrored parts.
Thanks again
regards, Cel
That's only half of the IFFT. The other half contained redundant information, so I cut it.
The algorithm is the standard Cooley-Tukey, with no zero-filling. Interpolating the input data merely made the output sequence longer, without improving the resolution. Interestingly enough, If I used an interpolation step which wasn't a binary submultiple of the sample interval (i.e 1/2, 1/4, 1/8 etc) it distorted the resulting waveform. Submultiples of 10 (i.e 1/10, 1/20 etc) produced very bad results.
It was fun.

Your file has 1200 x 10 complex data, with phase breaking at boundaries between every 1200 samples. This is expected in ofdm symbols.
Your 1200 samples imply frequency domain data for lte 20MHz. To get time domain data(you do fftshift then apply ifft of 2k and then add cp). Your 1200 samples don't show pilots populating bins in a clear way and hence your input doesn't mean much to me but your explanation of your task doesn't make sense either.
Moreover, applying fftshift then ifft is not going to show channel response. It just tells what you get from ifft (into time domain before any upsampling for air channel). So can you rephrase your task please and also explain what do mean by pilots? has it got another name?
I don't see why you need to apply any frequency shift and you are applying it wrongly anyway.
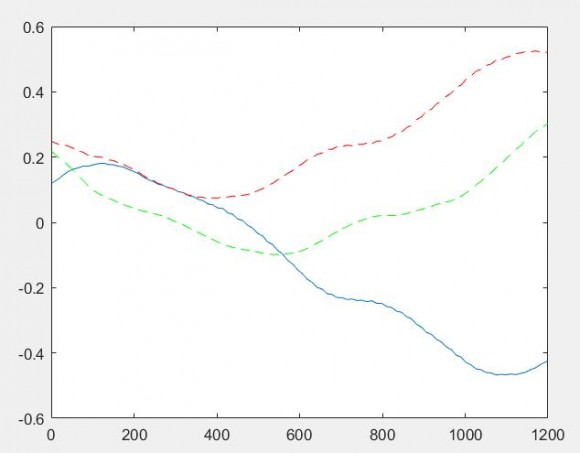
Here is your first 1200 samples (blue= Re, green = Im, red = abs)
Hi @kaz, I will rephrase my task below.
The measurement data is indeed from a 20 MHz LTE system with 1200 subcarriers. The measurements are the estimated channel frequency response as calculated by the LTE OFDM receiver. I assume the equalization method in the receiver uses pilot tones / reference signals in the OFDM symbols to calculate the channel attenuation and phase difference per subcarrier. So the measurement is channel frequency response (CFR), not actual data sent over the air. This is why I expect the output of the IFFT to be an impulse response.
The actual measurement only contains this channel frequency response for 100 of the 1200 subcarriers (this is one CFR measurement per 12 subcarriers) and I linearly interpolate to get a value for each of the 1200 subcarriers.
Your comment about the frequency shift is correct and I have already removed this shift from my later experiments.
What I struggle with right now is:
- how to correctly take 2048-point IFFT of my 1200 subcarriers (where to add zeros)
- how to interpret output of IFFT, in my experiments it always outputs a impulse response mirrored around 0 s
Thanks for your comment,
Cel
When you say channel do you mean eNB to UE channel (air) or let me ask this: who is sending to who (eNB to UE) or (UE or eNB).
From your descriptio the 1200 subcarriers imply eNB frequency data before ifft so where is the channel in this context. i.e. it is eNB before ifft and so there is no channel yet.
The eNB ifft inserts zeros as follws:
positive tones (1:600), zeros, negative tones (1:600)
i.e. zeros are inserted in centre to top up vector to 2k
Hi @kaz, I believe the channel is UE sending to eNB and eNB is estimating the UL channel response based on pilot tones from UE.
I am aware LTE uses 1200 subcarriers in one direction (UL I think) and 1201 in the other direction (DL) but I don't think this matters for my task since I'm not looking at actual data transmitted on subcarriers but only at channel frequency response.
Thanks for the tip about zero insertion.
It looks like you are working on SRS (Sounding Reference Signal). This LTE channel is part of UL and used by a UE so that eNB checks channel for best scheduling for a given UE. The UE can send SRS over wide band (not just their portion of spectrum).
Thus your received signal must be UL frequency data generated from time domain signal after passing through fft stage of eNB UL.
so the question is how do you extract the relevant bins (for SRS) and how do you process it. There is no need to view the response as impulse response. There is no impulse applied but UE sends SRS which as far as I know are short preambles of a frequency sweep (Zadoff Chu or a computer generated signal if too short). The processing involves several steps that includes small iffts followed by fft. I haven't done this extraction and post processing myself but here is an example at fpga level (not full list):
- Take the 1200 frequency domain UL data tones (100 resource blocks).
- Extract 4 groups of 24 resource blocks from these 100 resource blocks
- Pick out odd and even resource block sets, group into 12 + 12 resource blocks (144 + 144 tones x 4 groups).
- Take a configured number of users for this data set (expected to be 8 or 4)
- Perform IDFT on the 12 resource blocks (144 tones) to give 144 time domain samples
- From these time domain samples, extract the data in time for the user - giving 18 or 36 time samples. The users are time domain multiplexed and have 18 samples each for 8 users or 36 each for 4 users (144/8 = 18 or 144/4 = 36).
- Pad the 18 or 36 extracted time domain samples to 24 or 48 samples.
- Perform a DFT to transfer to the frequency domain to generate a 24 or 48 frequency tone sample set.


