


How to estimate the real channel response from its PSD?
Assuming we want to measure one channel of a ADC, we send a white noise to this ADC and we can obtain a PSD estimation.
I can doing IFFT on this PSD then estimate the channel response of ADC. However, this channel response is a complex value. The actual ADC channel response should be real (here I only measure one tributary).
My question is, is there any way to estimate the real channel response?
Below is the code to estimate frequency response from PSD. The problem is h is a complex number. What I wanted is the real channel response h_tx.
clear; clc; close all;
N = 1E5;
% FFT size
nFFT = 2^10;
% Emulate channel response of ADC
% h_tx = rcosdesign(0.5,16,4,'normal');
h_tx = exp(-(1:3)/10); h_tx = resample(h_tx,3,1);
% Pass white noise into ADC
L = (length(h_tx)-1)/2;
x = randn(1,N);
y = conv(h_tx,x);
figure; pwelch(y,nFFT,0,[],1,'centered');
% hold on; pwelch(x,nFFT,0,[],1,'centered');
% Estimate the channel response from PSD
[psd,f] = pwelch(y,nFFT,0,[],1,'centered');
h = ifft(fftshift(sqrt(psd)));
h = fftshift(h);
figure; stem(real(h),'.-'); grid on; hold on; stem(imag(h),'.-');
p = max(abs(h))/max(abs(h_tx));
stem(nFFT/2+1+(-L:L),h_tx*p,'o-');
figure;
freqz(h_tx); hold on; freqz(h);

Hi Hao,
I see a number of responses and observations on symmetry of the PSD and the associated realness of the IFFT. All of this, the theory, is true. However, I think there is a bigger problem with your general approach to solving the problem. Your particular device-under-test (DUT), h_tx = rcosdesign(0.5,16,4,'normal'), is a symmetric FIR low-pass filter. This is a very special symmetric-in-time case. And for this special case, your PSD-based approach works. As a general rule however, you cannot take the IFFT(PSD) and recover the impulse response of a DUT. The reason for this is that you are throwing away phase information using welch's PSD computation.
What you are actually doing is a form of non-parametric system identification where the goal is to recover the impulse response of a system from a frequency domain measurement. In order to do that however, you will need both magnitude and phase information. Typically you would also need to measure both the excitation and the response spectrums and ratio them carefully. Conventionally this would involve both a cross-spectrum and auto-spectrum computation, again, where the cross-spectrum includes the ever-vital piece of phase information. From this complex frequency response, you could then IFFT and get an accurate impulse response of your DUT. There are many i's to dot but that's one approach to solving the problem. I have a video on youtube which shows the details of this technique. It uses Simulink but every step is laid out bare such that you could also use duplicate the approach in MATLAB as well.
Again, this is just one approach...
To see the problem with your current approach, try a different DUT, e.g. an IIR filter, say an elliptic low-pass filter. I've modified josefsepp (Hoffman's) code below to show this, which is only a small modification of your original example. You'll see that the recovered impulse response is not a good estimate of the DUT.
clear; clc; close all;
rng(123);
N = 1E5;
% FFT size
nFFT = 2^10;
% Emulate channel response of ADC
h_tx = rcosdesign(0.5,16,4,'normal'); % DUT1
[b,a] = ellip(3,1,40,.2); % DUT2
h_tx = impz(b,a);
h_tx = h_tx(1:65); % equating length to rcosdesign
% h_tx = exp(-(1:3)/10); h_tx = resample(h_tx,3,1);
% Pass white noise into ADC
L = (length(h_tx)-1)/2;
x = randn(1,N);
y = conv(h_tx,x);
figure(1);
%pwelch(y,nFFT,0,[],1,'centered');
pwelch(y,nFFT,0,[],1,'twosided');
% hold on; pwelch(x,nFFT,0,[],1,'centered');
% Estimate the channel response from PSD
%[psd,f] = pwelch(y,nFFT,0,[],1,'centered');
[psd,f] = pwelch(y,nFFT,0,[],1,'twosided');
%h = ifft(fftshift(sqrt(psd)));
h = ifft((sqrt(psd)));
h = fftshift(h);
figure(2);
stem(real(h),'.-'); grid on;
hold on;
stem(imag(h),'.-');
p = max(abs(h))/max(abs(h_tx));
stem(nFFT/2+1+(-L:L),h_tx*p,'o-');
legend('recovered_h','h_tx')
figure(3);
freqz(h_tx);
hold on; freqz(h);
Hi kschutz,
Yes you are right, with my method I can only estimate the frequency amplitude response while not phase response.
For the method you mentioned, I feel it's similar to the cross-correlation method used for Wiener/Volterra kernel identification in nonlinear system (Sci-Hub | Measurement of the Wiener Kernels of a Non-linear System by Cross-correlation†. International Journal of Control, 2(3), 237–254 | 10.1080/00207176508905543). Previously I did some work on the Volterra kernel identification, but didn't go deep into it since lack of experiment setup.
I am very interested in the Simulink project you shared, but I can't find it in my Matlab (R2019b). Is it unreleased? Can I obtain it somewhere e.g. https://www.mathworks.com/matlabcentral/fileexchan...?
Regards,
Hao
You can download the cross-spectrum based Simulink example from github by going to the YouTube link I provided and expanding the "description" section. There will be a line of text like this in said description.
Download this example on GitHub: https://bit.ly/3oMW60r
The technique described is primarily for linear systems. For non-linear systems, Volterra series like you mentioned and others are more relevant. My video shows what I'm calling a well-worn and robust frequency response estimation method which computes a cross-spectrum between the response and excitation and divides (normalizes) by the auto-spectrum of the excitation.
There is also a block in Simulink called Discrete-Transfer Function Estimator which does something very similar all under one roof but it only works for discrete-time inputs and it requires an additional tool, DSP System Toolbox. The advantage of the approach I show in the Youtube link is that you can build it up yourself from primitives which aids in understanding and debugging and it supports analog (continuous-time) inputs as well, i.e. it's a superset of the other.
If you are interested in a Volterra series based approach, you can read this whitepaper and download the associated models/code here:
https://ww2.mathworks.cn/company/newsletters/artic...
But that goes well beyond this thread so I'll stop there. That's a big topic, opening Pandora's box.
All the best.
Kerry
Hi Kerry,
Thanks a lot for sharing this example, and the Volterra code!
The cross-spectrum based example looks more easier of implementation/test in practice, since it doesn't require signal synchronization.
The Volterra example is actually similar to what I simulated previously, with Matlab's Saleh model (comm.MemorylessNonlinearity). Compared to cross-spectrum method, it requires input/output signal synchronization.
Regards,
Hao
Hello,
I'm not an expert on this. But just a brief google search came up with this post, with the most relevant part in the answer at the end, in my view. Seems the imaginary part should be at or close to zero, and any magnitude reflects non-infinite precision in the calculations. If it's not at or close to zero, some review of the code may be required
https://dsp.stackexchange.com/questions/37272/how-...
"The same story happens with complex transforms. From a real data, the transformed and inverse may look complex, but generally the imaginary part is small enough. If it is not, it is a sign that there is a mistake in the code."
Regards,
Robert
Hi Robert,
Thanks for sharing the link.
I still can't ensure if the conclusion "the imaginary part should be at or close to zero" generally holds with some proof.
Let's me think over further. Thanks!
Regards,
Hao
Hao,
Sounds good, please do share if you are able to generate more rigorous proof.
Regards,
Robert
Hi Robert,
See the latest post from Hoffmann. He has pointed out my bug, and I further confirm that the IFFT of PSD must be real with a simple proof.
Regards,
Hao
Bravo, good job. You have your problem resolved, and we have all learned something interesting in the process ;)
Best,
Robert

Hi,
The imaginary part of h is very small compared to the real part, here their maximum values;
>> max(real(h)), max(imag(h))
ans =1.4761
ans = 0.0099
Hence, you may ignore the imaginary part of h.
Hi omersayli,
Thanks for your reply. In the example script the imaginary part of h is very small compared to real part, but I am not sure if the conclusion holds in general...
Regards,
Hao

If you pass real only input through fft then ifft you will get back your real input with a bit of free imaginary computation noise. This may not apply in your example because you apply averaging to fft (pwelch) but not to ifft.
I think you can simplify your idea. Use impulse input instead of random signal. Then you do not need averaging and you do not need fft/ifft chain either as your conv function returns time domain directly. see below:
N = 1E5;
h_tx = exp(-(1:3)/10);
h_tx = resample(h_tx,3,1);
x = zeros(1,N);
x(1)= 1;
y = conv(h_tx,x);
y = y(1:512);
figure;freqz(h_tx);
figure;freqz(y);
%%%%%%%%%%%%%%%%%%%%%%%%%%%%%%%
But we are just proving well known concepts. So no specific purpose.
Hi kaz,
Background of my application is an optical communication system, I want characterize the receiver side frequency response (only frequency amplitude).
For the optical system, there is some optical/electrical conversion thus "impulse input" source in not easy.
Instead, we can easily inject an white noise and measure the PSD in receiver side.
Regards,
Hao
In that case apply a frequency sweep signal (chirp) instead of random input. The chirp signal to cover your bandwidth. Then check through fft ratio of chirp input /received output and get amplitude from complex pair. No need to do ifft followed by freqz though you can go that way as well.
Phase is also doable but is a bit more work. You don't need it anyway.
You can apply same to random input but is too noisy.
Hi kaz,
A good idea to use chirp signal as input.
One another problem in my application is I want to separately characterize the Tx and Rx side frequency response. So I need think how to trigger the "chirp signal" w/o introducing Tx frequency response. (the white noise input needn't to be triggered by Tx, some instrument can generate well white noise)
Regards,
Hao
You can try white noise. Apply same idea of fft ratio of noise/received signal instead of freqz path. You can apply averaging to fft (e.g. pwelch) to reduce effect of noise variation.
Thus the idea is to do fft only without the need for ifft followed by freqz which just takes you back to fft.

Hi
I think I found the bug. The option 'centered' in the command pwelch has to be replaced with 'twosided'. This gives the correct symmetry of the psd, which results in real values with the ifft.
Here are the changes in your program that give real values for the impulse response h.
clear; clc; close all;
N = 1E5;
% FFT size
nFFT = 2^10;
% Emulate channel response of ADC
h_tx = rcosdesign(0.5,16,4,'normal');
% h_tx = exp(-(1:3)/10); h_tx = resample(h_tx,3,1);
% Pass white noise into ADC
L = (length(h_tx)-1)/2;
x = randn(1,N);
y = conv(h_tx,x);
figure(1);
%pwelch(y,nFFT,0,[],1,'centered');
pwelch(y,nFFT,0,[],1,'twosided');
% hold on; pwelch(x,nFFT,0,[],1,'centered');
% Estimate the channel response from PSD
%[psd,f] = pwelch(y,nFFT,0,[],1,'centered');
[psd,f] = pwelch(y,nFFT,0,[],1,'twosided');
%h = ifft(fftshift(sqrt(psd)));
h = ifft((sqrt(psd)));
h = fftshift(h);
figure(2);
stem(real(h),'.-'); grid on;
hold on;
stem(imag(h),'.-');
p = max(abs(h))/max(abs(h_tx));
stem(nFFT/2+1+(-L:L),h_tx*p,'o-');
figure(3);
freqz(h_tx);
hold on; freqz(h);
It seems the 'centered' option adds additional values in the psd, which then disturbs the symmetry of the psd and leads to imaginary values in the impulse response.
Regards,
Hoffmann
Hi Hoffmann,
Thanks for finding the bug!!!
I would like confirm that the IFFT of correct PSD must be real with a simple proof:
- If the input signal x is real (like my application: real white noise passing through a ADC), then its PSD signal P(f) satisfies: P(f) = P(-f)
- For any real and symmetric P(f), its IFFT must be real.
For point 2:
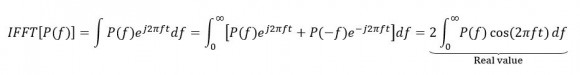
Regards,
Hao
Hi,
I finally got it, as you said, when using centered frequency result, we have to use ifftshift for the correct result instead of
h = ifft(fftshift(sqrt(psd)));
that line should be changed to
[psd,f] = pwelch(y,nFFT,0,[],1,'centered');
%h = ifft(fftshift(sqrt(psd)));
h = ifftshift(sqrt(psd));
h = fftshift(h);
In theory, both should work. Actually there is a very small difference in the results, which is caused by 1 sample delay (I plotted both results) in the frequency domain, caused by fftshifts.
Hi,
thank you I didn't know that!
Best regards
If it was me I will not have pwelch centred on dc, do ifft then centre its output. This avoids mistakes.
Edit(I now realised that Josefsepp had already coded it that way)


