Filter signal with fundamental and harmonics
I have a fundamental around 13.4MHz, along with its harmonics, as signal. Additionally, there is AWG and 1MHz tone as noise and interference respectively. I want to observe one cycle (of the fundamental) of the signal after filtering out the noise and interference - Time-domain shape is critical for me.
let the input be x(t) = a0*sin(w0*t) + a1*sin(4w0*t + ph0) + n(t) + b0*sin(w1*t)
i'm expecting the output should have one cycle of a0'*sin(w0*t) + a1'*sin(4w0*t + ph0') as close as possible. I’m sampling at 250MHz.
comment ?
edited : changing the fundamental freq example from 13M to 13.4M so that the interference(1M) is not harmonically related.

One rather straightforward approach (whether the first one here is effective enough is another matter) would be to bandpass filter the composite signal so that components at 13MHz to 52MHz will be passed with no phase shifts (other than linear phase shift / a delay).
The sample rate at 250MHz should be adequate to do this and a linear phase FIR bandpass filter should be feasible.
The question will be: is n(t) attenuated sufficiently? 86MHz of the noise will be attenuated out of 125MHz or 69%.
Another simple approach would be a linear phase FIR filter with 2 passbands at 13MHz and 52MHz. This would attenuate n(t) between 13Mhz and 52MHz if necessary.
One could also place a zero at 1MHz if necessary - not a big deal because the filters mentioned above all have a zero *specification* at 1MHz so this would be a matter of reinforcing that at 1MHz specifically. Depending on the filter design method/program that you use, this might be a matter of weighting the stop band more heavily at 1MHz.
If you do all of these things then I think you will be as close to what you need as can be obtained.
That said, it throws me off a bit when you say "Time-domain shape is critical".
Time domain shape of *what*? The output of the filter? The things above aren't going to affect the shape of the *desired* signals. BUT the remaining noise and interference will. You haven't specified the degree of "shape fidelity" whatever that means to you. One example would be: How accurate does the phase measurement have to be? Assuming a stationary signal, the longer the filter, the more the noise and interference attenuation, the better the estimate/measurement.
Saying "one cycle" is odd because it appears to assume perfection such that would be representative of a much longer record. Yet, there isn't going to be perfection. Perhaps it would make more sense to seek a "representative single cycle". In that case, a longer integration time is likely to be helpful - perhaps hundreds of cycles. So we don't want to confuse the two. For example, one cycle at 13MHz is 0.077usec in length and a filter with a band transition of 0.077usec will have a transition length of 13Mhz which is NOT what I had in mind in defining the filters above. Lot's say that the filter bandwidth of each of the two passband filters is 100kHz. This means the filter length is going to be maybe 30usec: 10usec for the lower band edge, 10usec for the upper band edge and 10usec for the band center. (There are good estimators if you care for more accuracy in these numbers).
On the other hand, saying "one cycle" might mean "I need to see the details of one *particular* cycle". That's a lot tougher problem.
So, it appears that a little more clarity in what you're really trying to accomplish would help us answer. Or, maybe those filters above will do the trick. It's easy enough to try.
FIR it tool costly at 250M. and IIR will kill my wave shape.
my case is like that in a CRO, you want to view a small duration of a signal with *all possible* details. it is not once *particular cycle*. it can be any equivalent cycle.
I realized that my stated
problem requires something like 'equivalent time sampling' technique. which is
common in oscilloscope signal processing. though it is also (ab ?)used in other
areas like radar. interestingly, this techniques is not popular in literature. I
got one material/whitepaper on this. Being a Nyquist fan it was hard to think
in this angle. but looks interesting. simply google 'equivalent time sampling'. I'll also keep looking.
There are lots of places where you can find a Windows executable of the Parks-McClellan program for FIR filter design. Such as:
http://www.ece.umd.edu/~tretter/enee425/
That's just one that I Googled up...
Equivalent time sampling is described here:
http://www.tek.com/document/application-note/real-...
In my mind's eye, it easy to see a correspondence between a relatively long FIR filter and equivalent time sampling. Consider that a narrow bandpass FIR filter will have a unit sample response that has a sinusoidal shape with the sinusoid being at the band center. For simplicity we'll assume that a signal is passed through this filter that's a bit off center frequency. Then each "cycle" of the filter coefficients will sample/multiply the signal at a different point in each cycle of the signal. All of these get added together. That's pretty much like equivalent time sampling where the triggers move across the signal.
Either way you look at it, there is a time averaging element involved and you will NOT see a single cycle of the waveform of interest.
It's contradictory to say:
"you want to view a small duration of a signal with *all possible* details. it is not once *particular cycle*. it can be any equivalent cycle."
"not one particular cycle" and "any equivalent cycle" suggest time averaging.
"small duration of a signal with all possible details" suggests the opposite.
That's because the details of one cycle will be different from the details of another cycle when there is noise, added signal components and modulation components. Harmonics in the normal sense such as you describe would be OK.
But, if you filter out the noise and the unwanted/uncorrelated signal components you would, in principle, be left with the signal of interest with its harmonics that you allow. Then each cycle should be the same or nearly so. Thus my question about specifications on accuracy of phase for example.
i tried simple matlab code with synthetic signal as described in the original post. it seems ok.
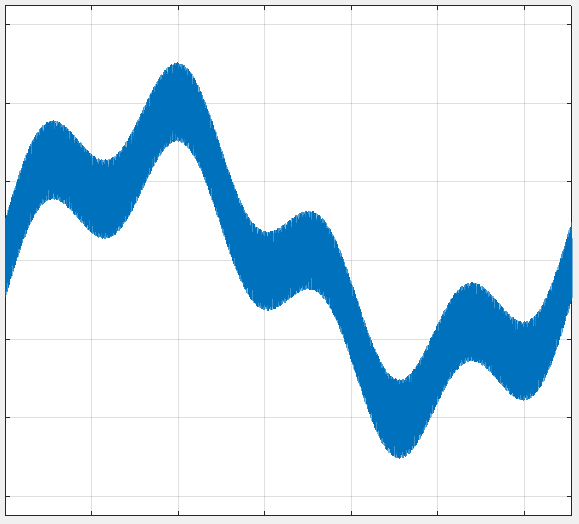

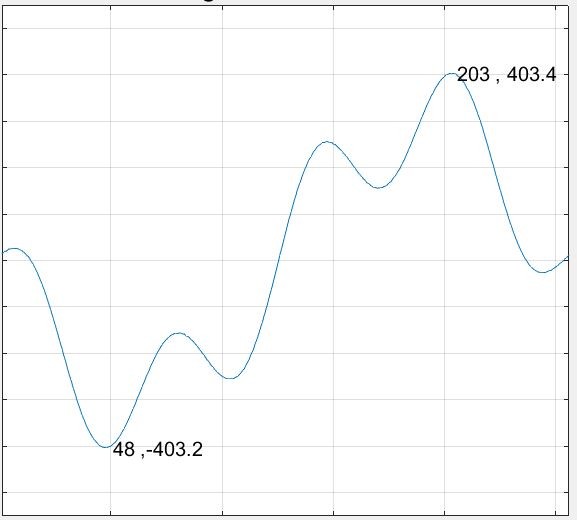
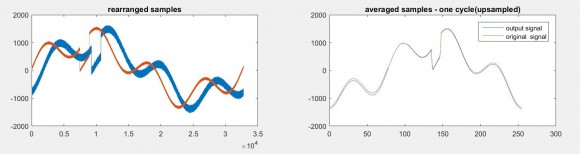
the first figure is output before averaging (all rearranged samples). the next figure is the output after averaging. and the next note that the thickness of the second trace is due missalinged samples from 1MHz and the noise.
the key here is to use more than one cycle. in fact several 100s of cycles. rearrange them based on period of fundamental and perform averaging.
anther point here is, the averaging is to get rid of white like noise and non-harmonically related components.
rearranging gathers all available details to the waveform cycle and averaging takes out (harmonically) unrelated components.
one thing i notes is, when we give only the signal with no noise/interference), the sharpness of the rearranged waveform is very sensitive to the detected fundamental period. to get more accurate fundamental freq, i used naive windowed full length fft with gaussian interpolation (parabolic in log spectra) around the peak.
as matter of fact, the mips requirement to realize the above is no way near my embedded reach;).
looking for a better freq estimation, to start with.problem is that there too many methods. i need to zero down to one which will give the most accurate freq in the known vicinity. back to google...
I can see the first picture but not the 2nd one.
Either way, it appears that you are computing the waveform using the expression in Matlab and then doing some things like "averaging" and "rearranging" which aren't defined.
It was not clear at all that you wanted to do frequency estimation. Rather, it appeared that you wanted to "observe" a cycle of one type or another. The objective of that observation wasn't so clear.
I've suggested some things that would likely help but the statement of the problem seems to be drifting.
the second waveform. i don't know why it is not getting displayed in the prv post.
to answer your q, the freq is required to compute the period of fundamental based on that only i rearrange the multi-cycle signal to single cycle.
I'm sorry. I'm really trying to help but it seems you are mixing objective with method. You asked a question and I believe I gave a good answer. Now we seem to be departing from the original question. Depending on the filtering, you should get something like this figure coming out of the described filter(s) only on a continuous basis.
Frequency estimation is another thing altogether. So when you say "the freq is required to compute the period" is the same as saying "the period is required to compute the fundamental frequency". And, it seems that this is tied to the method being used. So I'm unclear whether frequency estimation is an overall objective OR if it's simply a necessary ingredient to some method.
Can you tell us what the end objective is? Maybe some background on that as well?
Fred, i will explain how my problem migrated from filtering to frequency estimation. thanks for your patients and all supporting valuable technical points related to time domain filtering.
due to the nature of the target for which i'm trying to apply this soln to, i can't afford to have very long FIR filter. IIR filter will also effect the shape. freq domain filtering with SFFT or so will be too much resource intensive. so, i thought i will look for alternate routes. in first cut, ETS attracted my due to its simplicity lack of multiplication. additionally, it performs 'upsampling' so that i can visualize more details in a single period.
imo, ETS is not very intuitive, especially for filter design experts. so please read little about ETS. http://cp.literature.agilent.com/litweb/pdf/5989-8... has nice illustration, however not elaborate about its signal processing characteristics. but, you can makeout the crux of the approach.
the technique I used to create the attached plot is fully based on the 'equivalent time sampling (ETS)" which was I was not considering as a means to filter out signals. but in practice ETS is removing/suppressing all component except the harmonically related component. key to the ETS technique is that once should know the fundamental frequency. in my case, fundamental frequency is not knows. so, if i have to ETS to solve this problem, i have to estimate the fundamental accurately.
That's interesting but we still don't know what the end objective is. What is it???? Just to be clear, I don't mean the algorithmic approach or the details of it but what you hope to obtain in terms of information that will be useful to you or your "customer".
Not to thwart my own desire here but an observation about methods:
The ETS method can well be a "long term" approach and I have to wonder why, if that is acceptable, what's wrong with a long FIR filter .. let's say one of "equivalent length" or "analysis epoch"?
Fred, thanks for followup . i thought it is clear from the first mail.i'll try again. may be i mixed problem and solutions in my conversation.
first of all, keep the solution(s) away. - ETS approach and FIR approach.
let me make the problem statement once again with a different pitch. i've samples coming from an ADC at 250M SPS. i want to visualize the time domain shape of the waveform.
the features i am looking is repetitive with a frequency. this frequency i'm calling it as *fundamental frequency*.
further flexibilities, desirable features and constraints :
a. i need to visualize only information periodically.
b. i have MIPS limitation and can operate only with fixed-point math.
c. phase-noise is important as i need to preserve the waveshape.
d. desirable to have more visual granularity while viewing the cycle.
e. shall suppress information about harmonically unrelated components in the input. noise and interference.
f. no need to see output for all the time, it can be periodic, somewhat like in a triggered CRO.
now take the fir approach here:
i agree that FIR approach can address a, b,c and e.
however, the ETS approach leverages (f) to address (d). with a catch that information about fundamental is to be known or derived. which i'm yet to find a suitable solution.
Thank you, that clarifies things a lot for me.
Is this a reasonable re-statement:
"We want to observe a waveform with temporal resolution that is much shorter (i.e. finer) than the initial sample interval. Our situation is that there would be fewer than 20 samples per period of the fundamental waveform of interest. We'd like to see perhaps 10 times that number. The treatment of all of the signal components of interest needs to avoid phase distortion of the signal components of interest to maintain the waveshape and it needs to remove broadband noise and non-harmonically related constituents of the input while meeting the other objectives. The signal fundamental frequency is 13.4MHz and the 4th harmonic is of interest as well. Other than broadband noise, there is no other perturbations at the input between the fundamental and the 4th harmonic. The only periodic "interference" is at 1MHz."
?
Without tackling the MIPs and arithmetic limitations here are some thoughts that may help arrive at a solution (as I don't have a complete solution in mind at the moment):
This suggests the filtering that I'd mentioned earlier and maybe the single bandpass approach (12-53MHz passband) would work. But further, it suggests interpolation is needed. So I wonder what happens if we conceptualize a situation with an 8X (or 16x) interpolation factor?
The simplest interpolation is to repeat each sample 8 times (or 16 times) to increase the effective sample rate and then smooth the result. Other than streaming, this outputs the same number of samples as other approaches. One way to do this with simple operations is as follows:
1) repeat each sample one time to double the sample rate.
2) interpolate the results. The ideal interpolator would remove all of the original signal energy centered at 250MHz. But maybe a less-good interpolating filter would do. This is what half-band filters are used for.
3) Repeat steps 1 and 2 two more times to get 2x, 4x, 8x or 3 more times to get 16x. Note that the operations are the same at each step with just a different (and longer) time series at each step.
If you can do an FFT then you might apply the equivalent of a half-band filter to the 2x interpolated FFT (which is just a periodic repetition). Thereafter you can just zero out the remaining FFT samples between above 53MHz and below 1947MHz. A simple way to do this is to zero-pad the original FFT samples from 53MHz to 1947MHz. Then IFFT the sequence to get the time domain samples of the waveform of interest.
Perhaps there's a way to combine the bandpass filtering and the interpolation filtering to make it all more efficient. Otherwise, the filtering would precede step 2.
The point here is that there's no frequency estimation needed in order to have a set of samples that can be visually examined .. thus meeting the objective.
What is the effective interpolation factor that you've been getting?
almost there. however, the interference can come anywhere even between f1 and 4f1. AWG noise is also present throughout. this will make the FIR filter more complex.
to answer the queries :
What is the effective interpolation factor that you've been getting?
with 32k samples, 128 averaging for f1 = 13.4M, my upsampling rate is 13.72 Times.
if i didn't read about ETS, as you are also hinting, i would have gone ahead with a halfband allpass filter based filterbank or even DDC. interestingly, with ETS, my MIPS sheet is very compact even with all the inherent ASRC stuff.
So if finding the base period remains the challenge then sometimes an iterative method will work. For example, you might match the slope and value of the end points for selected values of the period and search for a minimum of the differences.
yep, you are right, THE solution lies in some adaptive algorithm, like LMS or variations. but i need to prepare little bit more to move forward in that direction. as of now i have FFT() + CZT() based solution which gives me 1ppm frequency estimation accuracy. mostly zoom fft variant also may give similar results with comparable resource sheet. my hope is that LMS ( or RLS ?) may give more computationally and statistically efficient solution. but i'm not yet ready for that jump. will read https://www.math.ucdavis.edu/~saito/data/sonar/boa... and 1 and 2 as preparation, when i really get time. as of now i need to move on, a hard reality. and moving on with FFT + CZT option. i know this is not the optimal solution and takes assumption on the stationary nature of the signal. but a good start and can scale. Thank you for all your comments and valuable insights. please do update in case you have any related information.

Comments. Hmm.
It sounds like you're not so much interested in the whole time-domain shape of the thing as you're interested in the fundamental, the 4th harmonic, and the phase relationship between them -- i.e., you really want to get your hands on \(a_0\), \(a_1\), and \(\phi_0\).
Is this correct? Or is the exact value of \(\omega_0\) unknown as well?
If \(\omega_0\) is known exactly I'd do a quadrature downconversion at \(\omega_0\) and at \(4\omega_0\), and from that information I'd extract \(a_0\), \(a_1\), and \(\phi_0\).
If \(\omega_0\) is not known exactly, but if the fundamental tone is distinct enough to lock onto, I'd either phase lock to the fundamental, then proceed as above, or (if \(\omega_0\) is guaranteed to be close enough) I'd take enough of a sample to reject whatever noise matters, then I'd extract the phase of the fundamental to compare with the phase of the 4th harmonic.
All of this depends on being able to low-pass your quadrature downconversion output long enough to average out the noise, including any of that 1MHz tone that's going to get mixed in due to \(\omega_0\) not being an integer multiple of the interfering tone. If that's not the case, then you'll need to get fancier.
since the signal which i'm interested in periodic ( tone with it's harmonics) it need to take care of only one cycle. in fact this is key aspect. i'm trying with something called 'equivalent sampling' approach or its variant. hope it should suffice.
ω0ω0 unknown as well. but, I/Q DDC will help only to know the LF or envelop components riding over it if any.
Not knowing \(\omega_0\) may well throw a wrench into your works, depending on your accuracy requirements and the amount of noise you need to contend with.
I'm reframing my "PLL and demodulate" suggestion to "find \(\omega_0\) and analyze". Just doing the math over 19 or 20 samples (i.e., roughly one sample of your carrier) should work, but your "4th harmonic" signal is no longer orthogonal to the carrier over one cycle, so you'll need to adjust it so that it is.
This will all fall flat on its face if you have significant noise, of course.
that exactly is the point, i need to estimate ω0 with min cost and tune the rest such that the only nω0 comes out.
note : I just edited numbers in the original problem statement to such that the fundamental and interference are not multiples.
another result for sharp waveform features.
here, the input contains w0 @1000, 4w0 @500, noise @100 and 1M@100
and an amplitude 'dip' of at w0 rate.
I used ETS with averaging 128. it will cost a lot to do the similar filtering with conventional FIRs.
I agree with you that I/Q DDC may have a soln as well. but too much to (re) adapt when the w0 changes.
still i have my efficient freq estimation issue as todo. but thought of sharing this 'not so' conventional approach.
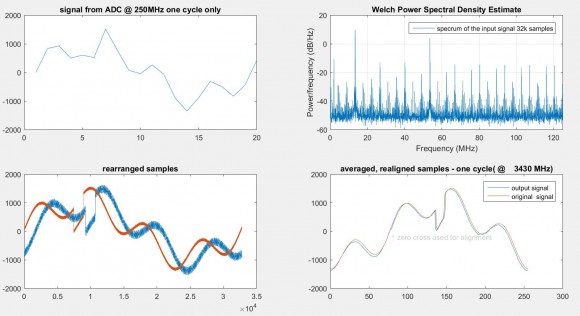
more complete view of the solution and its effectiveness. I used ETS on 32k samples with averaging 128. assumed input freq with 1ppm freq error from f1. note (4th subplot) that the signal starting point alignment has changed to make the comparison with original easy.
OK - thanks. I decided to dig into your ETS implementation to see if I could put it in more conventional terms so I could understand better. It seems that you're averaging 128 samples and sliding the windows over time span of 32,000 samples. It appears the end result will be 32,000/128 = 250 samples. This is in the range I rather suspected earlier. Is that right?
And, I guess that the application of the averager must be on a circular basis applied to the input samples? Is that right?
So, you have a FIR filter (the averager) with 128 coefficients (of 1.0); so it's a simple implementation. Then that filter is applied 250 times, or, if you wish, it's applied to the input sequence and the input sequence is limited to 32,000 samples.
Do you have Matlab code available?
as part of ETS, the first step is reshuffling the data such that samples corresponding to same phase comes together (this is the left handside plot of 32k Samples). then, based on the aveCount, the box car averaging is performed to get 256 samples. a more detailed read https://www.diva-portal.org/smash/get/diva2:612187... i've the code and is fairly simple. if you feel, i can find a way to share.
>>It appears the end result will be 32,000/128 = 250 samples. This is in the range I rather suspected earlier. Is that right?that is right. to be precise output samples = 32,768/128 = 256.
A way to share: "Insert File" should work.
here is the code used for the ets and associated plots.