


I have implemented a filter and passing composite signal with multiple frequencies.
I would like to measure the power of signal before and after filtering. This is for me to verify how signal has been affected in terms of power after filtering. Can someone guide me in this regard?
PS: I tried rms function in octave but it looks like this is not yet implemented. Next, I was thinking I could implement custom function myself.

rms = square root of mean of squared values.
so square each sample, get the mean of squares (this is mean power)
get square root of that if you wish

Hi. There are two types of "power" that we talk about regarding discrete sequence: (i) the "instantaneous power", and the (ii) "N-point average power".
The instantaneous power of an x[n] sequence is merely the sequence (x[n])^2.
The N-point average power of an x[n] sequence is merely summing (x[n])^2 + (x[n-1])^2 + (x[n-2])^2 + (x[n-3])^2 + ... + (x[n-(N-1)])^2. And then divide that sum by N to produce a single "N-point average power" sample. You repeat the summing and division operations as each new sample that arrives to your system. This "power" sequence could rightly be called the "N-point moving average power."
All,
Thanks a lot for your inputs.
Dear Rick,
Thanks. Probably, this is what I am looking for.
I would like to come back to my main intention of computing the power.
Input is made of 4 sine signals. Output is expected to filter the 3rd and 4th sine signals as they are above the filter cut off.
Now, I want to do the following,
1) measure the power of each input sine signal
2) measure the power of composite input signal
3) measure the power of signal that is output from filter
Just compare to see if the values co-relate. Ideally, I expect to see power from 3 and 4th sine to be filtered out.
Next, I want to play around with amplitudes of sine1, sine2, sine3 and sine4 and see its impact.
Am I going in the right direction in order to analyze the filter function?
I think your purpose is to measure effect of filter on power rather than measure power per se.
The best way (in software) is to inject an impulse input of unity power then look at filter output spectrum. It tells you what happens to power at every frequency.
Kaz,
Thanks. I could do that but what can I expect assuming the filter is a low pass filter?
As explained by Rick you look at input/output spectrum.
For unit impulse input, the spectrum will be a nice flat top all over frequencies. The filtered output of LPF should be 0dB at dc and as flat as 0dB as you approach cutoff where it starts to descend towards stop band. This is the case of dc unity filter. If it is above or below 0dB then you have lost unity gain though filter shaping may still be correct(but shifted up or down)
I hope I have done it correctly. The following is how the plots look like:
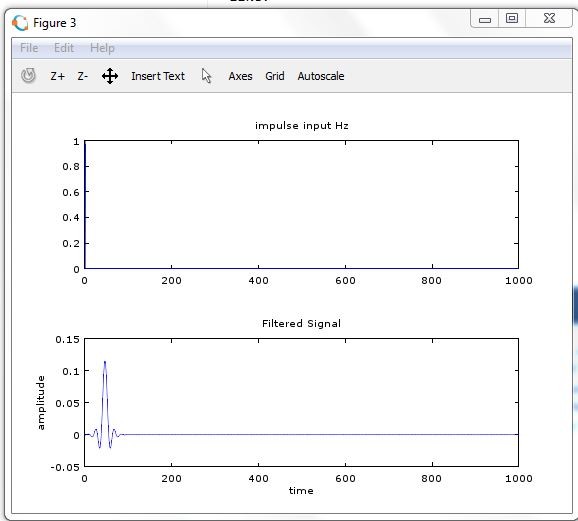
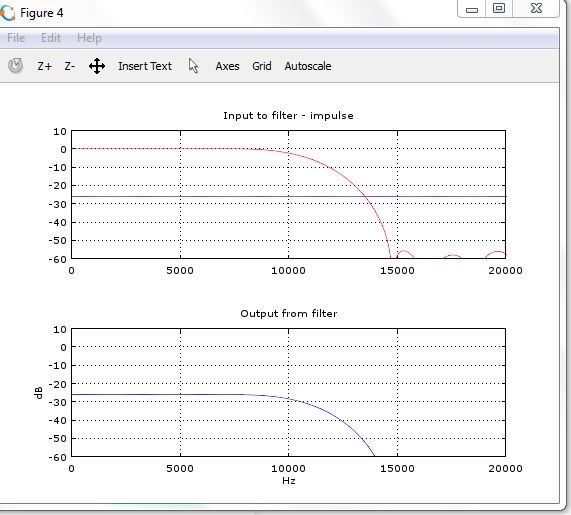
There are some funny scaling issues.
you can avoid all by just this command:
freqz(h);
Kaz, Rick,
I have used the approach given by Fernandoorg to measure power of various signals and it looks as below:
1 power of input signal 1.99495
2 power of output signal 0.963378
3 expected power of output signal 0.998553
4 power of sine 1 signal 0.499276
5 power of sine 2 signal 0.499276
6 power of sine 3 signal 0.499276
7 power of sine 4 signal 0.499276
Input signal is composed of the 4 sine signals whose power is given on line 4-7. Actual output power is given in line 2. I computed expected power by adding power of sine 1 and 2.
I am a little surprised that actual output power is less than expected output power. In reality I actual output power to be > expected output power due to the fact that beyond cut-off filter still allows frequencies although with certain degree of attenuation.
Can you please throw some light?
Well have you considered correlation issues. To explain that what is the power of two sine waves at same frequency but opposite in phase (zero isn't it)
Kaz,
in reality, such signals would cancel each other anyway even before they appear at the filter input. If I just compute power of 2 sine waves individually then it would have some finite power but when you add 2 of such sine signals and compute power then it would be 0.
I mean that when it comes to power addition you can add power of two or more signals if they are not correlated else the sum will vary depending on how much they cancel out each other. So doing power additions is not a good idea. Just use freqz(h) and it will tell you all.
A filter also changes phase (though linearly if symmetric fir) and this needs be taken into account.
thanks
Hi. kaz's March 4th comment told you how to measure the frequency behavior of your filter. You can verify the results of kaz's test by comparing the spectral magnitude (or spectral power) of your filter's input sequence and the spectral magnitude (or spectral power) the filter's output sequence. At the filter's output you should see greatly reduced spectral magnitudes for your 3rd and 4th sine waves.

I have another observation. It has been my experience that an arbitrary "long term average" may not be enough for an accurate measurement if the window length is less than the period of the lowest frequency of the signal's modulation due to not averaging an integral number of those low-frequencies. This "noise" is not due to the SNR of the signal!
This can be proactively corrected for signals modulated with fixed frequencies (ignoring Gaussian noise, which an "average of averages" can reduce) rather than pseudo-random frequencies like voice. My experience has been with VOR and ILS signals that have periods of 30 Hz and 15 Hz, respectively, In my case, I was trying to create an instrument to accurately measure these signals to ensure safe landings and enroute guidance.
As an example, if the period of averaging is not harmonic with the "characteristic" frequency, then there will be not only variations due to noise, but perhaps more significantly, due to cyclic truncation.
Note that a simple average is the DC part of a Fourier transform and those too are subject to Gibbs ripple phenomenon, which is cyclic truncation. The measurement variation due to noncyclic (nonharmonic) sampling can be quite large.
Hi artmez. I think your comments are very sensible.

You can measure the energy of the signal as the squared sumation of all its samples. It could be something like
energy = sum(x.^2)
where x is the signal to be measured.
The power of a signal is a time-average value, then you should take the calculated energy and normalize it in time.
If N is the number of samples in x you could do something like
power = (1/N)*energy
Finally the RMS value of the signal is obtained by taking the square root of the power, so
rms = sqrt(power)
Hope it helps! My apologies for my poor english

My apologies for my poor english
It seemed perfect to me; no need to apologize. :-)

The only thing that I'd add to this is that if you're RMS-ing noise, it can take an astonishingly long averaging interval to get a good-looking output. I've never sat down and done the math, but it's like tens or hundreds times longer than 1/bandwidth.


