


Filter complex signal and get spectra
How to correctly get spectrum of filtered complex signal in time domain?
Filter with real coefficients (LPF). [1 2 1]
The frequency response is in general a complex quantity, in most cases obeys certain symmetry properties. Сomplex signal not symmetry.
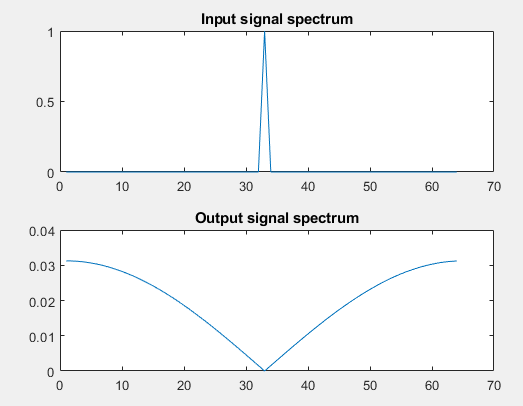
As can be seen from Fig., The spectra obtained shows when I filter the signal, the filter becomes not a LPF, but a band stop filter!!!
Here the question, how correctly filter complex signal. And if I filter correctly, then how get correct spectrum of output signal.
To experiment try code below.
clear all
clc
Fs = 64; % Sampling frequency
T = 1/Fs; % Sampling period
L = 64; % Length of signal
t = (0:L-1)*T;
%% Init filter
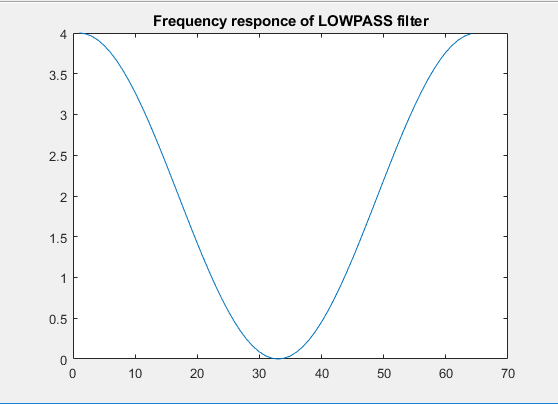
b = [1 2 1]; % FIR coef
h = freqz(b,1, L, 'twosided');
figure(1)
plot(abs(h))
title('Frequency responce of LOWPASS filter')
%% Init signal
f = 32; %freq
x = exp(j*2*pi * f.*t);
re = real(x);
im = imag(x);
%% Process filtering in time domain
s = filter(b,1,x);
s_re = real(s);
s_im = imag(s);
figure(2)
subplot(4,1,1)
plot(re)
title('In-Phase input signal')
subplot(4,1,2)
plot(im)
title('Quadrature input signal')
figure(2)
subplot(4,1,3)
title('In-Phase output signal')
plot(s_re)
subplot(4,1,4)
plot(s_im)
title('Quadrature output signal')
%% Get spectra one way
figure(3)
subplot(2,1,1)
plot(abs(fft(x))/L)
title('Input signal spectrum')
subplot(2,1,2)
plot(abs(fft(s))/L)
title('Output signal spectrum')
%% Or another way
% Get spectrum in each component
spec_x_re = abs(fft(re))/L;
spec_x_im = abs(fft(im))/L;
spec_s_re = abs(fft(s_re))/L;
spec_s_im = abs(fft(s_im))/L;
figure(4)
subplot(4,1,1)
plot(spec_x_re)
subplot(4,1,2)
plot(spec_x_im)
subplot(4,1,3)
plot(spec_s_re)
subplot(4,1,4)
plot(spec_s_im)

Hello,
Ran you code and looked at the output.
Problem is that you are looking at the spectrum of the startup transient of an extremely short filter with a high frequency signal, Fs/4.
Cut off the points in the beginning.
Cheers,
Mark Napier
I apologize, but I am struggling a bit with your English (no offense intended, I only speak one language and am still prone to mistakes). It seems like you are trying to filter a complex sinusoid with a frequency of 32, at a sample rate of 64, with a filter that should stop that frequency perfectly. Is that correct?
So what you were presumably expecting to see was 0 output. However, you are seeing this very small output instead. This is because your input data is not an infinite sine wave. When you run the filter routine, it has to make an assumption about what the data was before the first sample, that it was zero. This results in the leakage you are seeing. I would expect that as you increase the length of your transform, the output spectra will get smaller and smaller as the effect of the initialization becomes small relative to the sample size.
However, it would seem that you are doing your filtering correctly, so I hope that helps.


