


Octave Frequency response of a filter - fft vs. freqz
Hello
I am trying to calculate the frequency response of the filter using freqz and the fft of the impulse response (I am using octave) The problem is that the 2 response are identical only for the cut off frequency of the filter and I cannot figure out where is the problem....
clear all; close all; clc; N = 1024; % Number of points to evaluate at Fs=200;
%50Hz notch filter butterworth gain = 1.003141603e+00; coefficient1 = -2.22045e-16; coefficient2 = -0.9937364715; coefficient3 = 0.0000000000;
b=[1/gain, coefficient1/gain,1/gain]; a=[1, -coefficient3, - coefficient2]; [h, w] = freqz (b, a,N,'whole',Fs);
figure
subplot(2,1,1) plot(w,20*log10(abs(h))); title('Notch filter -- freqz'); grid on xlabel('Frequency'); ylabel('Magnitude(dB)') subplot(2,1,2) plot(w, -angle(h)*180/pi) grid on xlabel('Frequency'); ylabel('Phase(Degrees)')
xi=zeros(1,N);xi(1)=1;
y=filter(b,a,xi);
wherz2=(0:N-1)*(Fs)/N;
H3=(fft(y));
figure
subplot(2,1,1) plot(wherz2,20*log10(abs(H3)),'*b');hold on; plot(w,20*log10(abs(h)),'r'); title('Notch filter -- Impulse/freqz'); grid on xlabel('Frequency'); ylabel('Magnitude(dB)') legend('impulse','freqz'); subplot(2,1,2) plot(wherz2, -angle(H3)*180/pi,'*b');hold on; plot(w, -angle(h)*180/pi,'r') grid on xlabel('Frequency'); ylabel('Phase(Degrees)') legend('impulse','freqz');

Hi chab.
You didn't ask a specific question so I don't know what you're asking us. But I'll take a guess at what's bothering you.
Your IIR filter is a super-narrowband notch filter with the notch centered at Fs/4. Is that what you intended? The filter's pole/zero plot is:
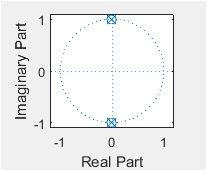
The poles are just a bit inside the unit circle. YOur filter's freq magnitude response is:
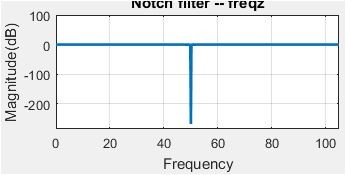
where 100 Hz is half the sample rate.
The reason your FFT magnitude of the impulse response doesn't look similar to the freqz magnitude response is because your impulse response has too few samples. Your 'y' sequence does NOT capture the filter's complete (entire) impulse response. Increase the length of your 'xi' impulse sequence by a factor of eight and your two spectral magnitude responses will then look much more similar.
By the way chab, what's the purpose of your filter? Do you plan to use that filter to notch filter some input signal? If so, what kind of input signal?
Thank you very much for your reply Rick Lyons.
In fact with a length for xi of 32768 samples it is working.
Best regards
Hi chab. You are welcome.
We can learn a useful lesson here. You were the victim of a situation I've experienced many times over the years. We have a digital system and we test it to see if it behaves the the way we desire. But because our testing method was incorrect our test results don't look correct. So the question we must ALWAYS ask is; "If our test results don't look correct is the problem with our digital system or is the problem with our testing method?
I am using this filter to suppress a component at 50 Hz which is not useful for me
Hi chab. In fact, right now, I'm trying to test a digital single-sideband (SSB) communications application that uses IIR Hilbert transformers. I'm performing two different test methods that should be giving me the same test results, but they are not! So is my problem in my SSB system, in my Test Method# 1, or in my Test Method# 2? I hope to find out the answer before I die of old age.
Good luck Rick Lyons! I am sure that you will find the answer very soon!
Just for the record. In fact, before reading your answer I had already increased the number of samples for the impulse response xi (I had posted my answer on another blog and had to do the same here but you had already answered...). The result was that I now get the same graph for the amplitude but apparently a graph of the phase that is different (more accurate?). I come to the conclusion that I don't have enough knowledge of the freqz function and the digital impulse response (do I get a more accurate representation of the dirac function by increasing the number of samples?). So I have to review all this (vary N for freqz for example)... because I still don't know which of the 2 methods is the most faithful to the system's response.

Freqz is built on fft. In the case of FIR both will quickly show same behavior with impulse input as long as enough of fir is at output. In case of IIR it gets more accurate the more output samples you check as response is infinite. Try set your den to 1 and see
thank you for your reply kaz. I will do it.


