


Fundamental Frequency Estimation from Spectral Peaks
Spectral peak measurement was discussed in Chapter 5.
Given a set of peak frequencies ![]() ,
,
![]() , it is usually
straightforward to form a fundamental frequency estimate
``
, it is usually
straightforward to form a fundamental frequency estimate
``![]() ''. This task is also called pitch detection, where the
perceived ``pitch'' of the audio signal is assumed to coincide well
enough with its fundamental frequency. We assume here that the signal
is periodic, so that all of its sinusoidal components are
harmonics of a fundamental component having frequency
''. This task is also called pitch detection, where the
perceived ``pitch'' of the audio signal is assumed to coincide well
enough with its fundamental frequency. We assume here that the signal
is periodic, so that all of its sinusoidal components are
harmonics of a fundamental component having frequency ![]() .
(For inharmonic sounds, the perceived pitch, if any, can be complex to
predict [54].)
.
(For inharmonic sounds, the perceived pitch, if any, can be complex to
predict [54].)
An approximate maximum-likelihood ![]() -detection
algorithm11.1 consists
of the following steps:
-detection
algorithm11.1 consists
of the following steps:
- Find the peak of the histogram of the
peak-frequency-differences in order to find the most common harmonic
spacing. This is the nominal
 estimate. The matlab
hist function can be used to form a histogram from the
measured peak-spacings.
estimate. The matlab
hist function can be used to form a histogram from the
measured peak-spacings.
- Refine the nominal
estimate using linear
regression. Linear regression simply fits a straight line through
the data to give a least-squares fit. In matlab, the function
polyfit(x,y,1) can be used, e.g., p =
polyfit([0,1],[1,1.5],1) returns p = [0.5,1], where
p(1) is the slope, and p(2) is the offset.
- The slope p(1) of the fitted line gives the
estimate.
Useful Preprocessing
In many cases, results are improved through the use of preprocessing of the spectrum prior to peak finding. Examples include the following:
- Pre-emphasis: Equalize the spectrum so as to flatten it.
For example, low-order linear-prediction is often used for this purpose (the ``flattened''
spectrum is that of the prediction error). In voice coding, first-order linear
prediction is typically used [162].
- Masking: Small peaks close to much larger
peaks are often masked in the auditory system. Therefore, it
is good practice to reject all peaks below an inaudibility threshold
which is the maximum of the threshold of hearing (versus frequency)
and the masking pattern generated by the largest peaks
[16]. Since it is simple to extract peaks in
descending magnitude order, each removed peak can be replaced by its
masking pattern, which elevates the assumed inaudibility threshold.
Getting Closer to Maximum Likelihood
In applications for which the fundamental frequency ![]() must be
measured very accurately in a periodic signal, the estimate obtained
by the above algorithm can be refined using a gradient search
which matches a so-called harmonic comb to the magnitude
spectrum of an interpolated FFT
must be
measured very accurately in a periodic signal, the estimate obtained
by the above algorithm can be refined using a gradient search
which matches a so-called harmonic comb to the magnitude
spectrum of an interpolated FFT ![]() :
:
![$\displaystyle \arg\max_{{\hat f}_0} \sum_{k=1}^K
\log\left[\left\vert X(k{\hat f}_0)\right\vert+\epsilon\right]$](http://www.dsprelated.com/josimages_new/sasp2/img1721.png)
![$\displaystyle \arg\max_{{\hat f}_0} \prod_{k=1}^K \left[\left\vert X(k{\hat f}_0)\right\vert+\epsilon\right]
\protect$](http://www.dsprelated.com/josimages_new/sasp2/img1722.png)
where
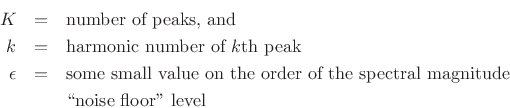
The purpose of
![]() is an insurance against multiplying the
whole expression by zero due to a missing partial (e.g., due to a
comb-filtering null). If
is an insurance against multiplying the
whole expression by zero due to a missing partial (e.g., due to a
comb-filtering null). If
![]() in (10.1), it is
advisable to omit indices
in (10.1), it is
advisable to omit indices ![]() for which
for which
![]() is too close to a
spectral null, since even one spectral null can push the product of
peak amplitudes to a very small value. At the same time, the product
should be penalized in some way to reflect the fact that it has fewer
terms (
is too close to a
spectral null, since even one spectral null can push the product of
peak amplitudes to a very small value. At the same time, the product
should be penalized in some way to reflect the fact that it has fewer
terms (
![]() is one way to accomplish this).
is one way to accomplish this).
As a practical matter, it is important to inspect the magnitude
spectra of the data frame manually to ensure that a robust row of
peaks is being matched by the harmonic comb. For example, it is
typical to look at a display of the frame magnitude spectrum overlaid
with vertical lines at the optimized harmonic-comb frequencies. This
provides an effective picture of the ![]() estimate in which typical
problems (such as octave errors) are readily seen.
estimate in which typical
problems (such as octave errors) are readily seen.
References on
Estimation
An often-cited book on classical methods for pitch detection,
particularly for voice, is that by Hess [106]. The
harmonic-comb method can be considered an approximate
maximum-likelihood estimator for fundamental frequency, and more
accurate maximum-likelihood methods have been worked out
[65,297,230,231].
Another highly regarded method for ![]() estimation is the YIN
algorithm [55]. For automatic transcription
of polyphonic music, Klapuri has developed methods for multiple
estimation is the YIN
algorithm [55]. For automatic transcription
of polyphonic music, Klapuri has developed methods for multiple ![]() estimation
[189,127,126,124].11.2Finally, a rich source of methods may be found in the conference
proceedings for the field of Music Information Retrieval
(MIR)11.3 Of course, don't
forget to try a Web search for ``F0 estimation'' and the like.
estimation
[189,127,126,124].11.2Finally, a rich source of methods may be found in the conference
proceedings for the field of Music Information Retrieval
(MIR)11.3 Of course, don't
forget to try a Web search for ``F0 estimation'' and the like.
Next Section:
Cross-Synthesis
Previous Section:
STFT Summary and Conclusions


