


Adventures in Signal Processing with Python
Author’s note: This article was originally called Adventures in Signal Processing with Python (MATLAB? We don’t need no stinkin' MATLAB!) — the allusion to The Treasure of the Sierra Madre has been removed, in deference to being a good neighbor to The MathWorks. While I don’t make it a secret of my dislike of many aspects of MATLAB — which I mention later in this article — I do hope they can improve their software and reduce the price. Please note this represents opinions that are my own, and do not reflect those of my employer or of this website’s publisher.
OK, now back to some down-to-earth topics after that last philosophical diversion. This post will be a short tour of PyLab, and a springboard for a number of other topics — including that long-awaited sequel to encoder speed estimation.
At work, we use MATLAB as data analysis and visualization software. But my group only has it available on a shared laptop. And I got tired of having to share. :–) So I started looking at alternatives.
Scilab, Octave, Sage… all were kind of flaky, and didn’t seem to have the features and richness I wanted. Then I found out about PyLab.
PyLab is a Python environment for scientific computation that includes the following packages:
- matplotlib for graphing and data visualization
- numpy for fundamental numerical analysis (vectors, matrices, and scientific functions that operate on them)
- scipy for scientific and engineering applications.
Hold on a minute — this is an embedded systems blog, right?! Python won’t run on a resource-limited embedded system, and in fact Python is one of my three criteria….
Signs You Aren’t Working on a Resource-Limited Embedded System:
- You have an operating system with a command shell.
- You can run Python.
- There’s a compiler that runs on your system, so you don’t need a cross-compiler.
So if you’re using Python, you’re not really doing embedded system development. But that’s okay. Because you need to expand your horizons. Don’t be a one-trick pony and get stuck in C and assembly development for your favorite processor of choice!
Anyway, there’s lots of times when I have to stop programming and try out the theory of some idea I have. And lately PyLab has been a huge help.
Here are some examples of what it can do. But first, a caveat:
We do need stinkin' MATLAB?!
I need to be clear that this post is aimed at engineers (particularly embedded systems developers) who have signal processing, data analysis, and visualization work to do as a secondary part of their job.
For those of you who are doing full-time, hardcore signal processing or control systems design, MATLAB is probably the right tool for the job. If your company can afford to pay you for 40 hours a week, they can probably afford MATLAB as well.
If the cost wasn’t an issue, I’d love to use MATLAB, and I’d get all the toolboxes I could.
I am also not going to present in-depth discussion of signal processing or control systems algorithms (z-transforms, FFTs, root-locus plots, Nichols charts, etc.). And I’m not going to tell you step-by-step instructions for using Python and PyLab. This is merely a tour of PyLab to pique your interest.
Example applications
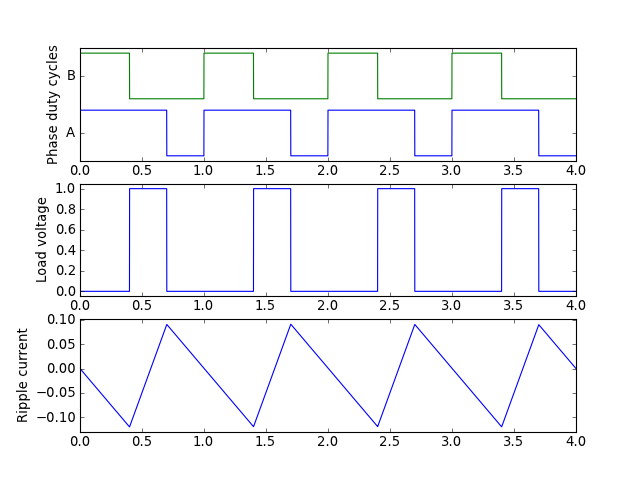
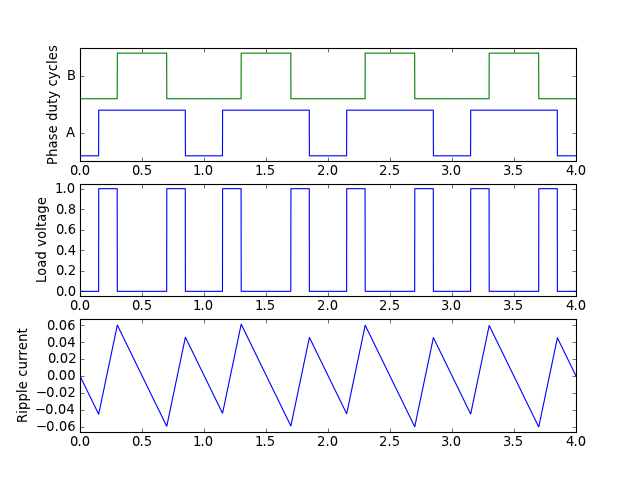
Suppose you need to understand ripple current in an H-bridge with an inductive load, under edge-aligned and center-aligned pulse-width modulation.
Here’s some plots of ripple current, along with a short Python script that I used to produce them:
Edge-aligned PWM:
Center-aligned PWM:
import matplotlib.pyplot as plt
import numpy
import scipy.integrate

t = numpy.arange(0,4,0.001)

# duty cycle on phase A and B
Da = 0.70
Db = 0.40

def extendrange(ra,rb):
  if ra is None:
    return rb
  elif rb is None:
    return ra
  else:
    return (min(ra[0],rb[0]),max(ra[1],rb[1]))

def createLimits(margin, *args):
    r = None
    for x in args:
        r = extendrange(r, (numpy.min(x),numpy.max(x)))
    rmargin = (r[1]-r[0])*margin/2.0
    return (r[0]-rmargin,r[1]+rmargin)

def showripple(centeralign=False):
    # voltage waveforms on phases A and B

    if centeralign:
      sawtooth = abs(2*(t % 1) - 1)
      Va = sawtooth < Da
      Vb = sawtooth < Db
    else:
      ramp = t % 1
      Va = ramp < Da
      Vb = ramp < Db

    Vab = Va - Vb

    def ripple(x,t):
      T = t[-1]-t[0]
      meanval = numpy.mean(x)
      # cumtrapz produces a vector of length N-1
      # so we need to add one element back in
      return numpy.append([0],scipy.integrate.cumtrapz(x - meanval,t))

    Iab = ripple(Vab, t)

    # plot results
    margin = 0.1
    fig = plt.figure(figsize=(8, 6), dpi=80)
    ax = fig.add_subplot(3,1,1)
    y = [Va*0.8, Vb*0.8+1]
    ax.plot(t,y[0],t,y[1])
    ax.set_yticks([0.4,1.4])
    ax.set_yticklabels(['A','B'])
    ax.set_ylim(createLimits(margin,y[0],y[1]))
    ax.set_ylabel('Phase duty cycles')

    ax = fig.add_subplot(3,1,2)
    ax.plot(t,Vab)
    ax.set_ylim(createLimits(margin,Vab))
    ax.set_ylabel('Load voltage')

    ax = fig.add_subplot(3,1,3)
    ax.plot(t,Iab)
    ax.set_ylim(createLimits(margin,Iab))
    ax.set_ylabel('Ripple current')
    savefile = 'pwm-%s-1.png' % ('center' if centeralign else 'edge')
    fig.savefig(savefile, dpi=fig.dpi)

showripple(centeralign=False)
showripple(centeralign=True)
plt.show()
Or comparing two 2-stage RC filters, one with identical RCs and one with impedances on the 2nd stage increased by 10 to reduce loading (note: schematic below not from Python but drawn manually in CircuitLab):
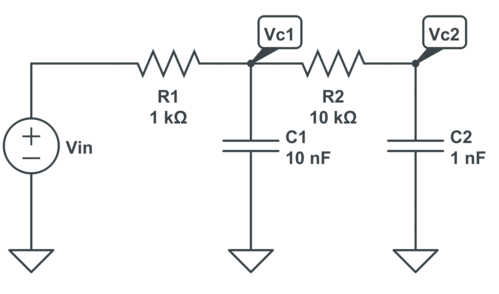
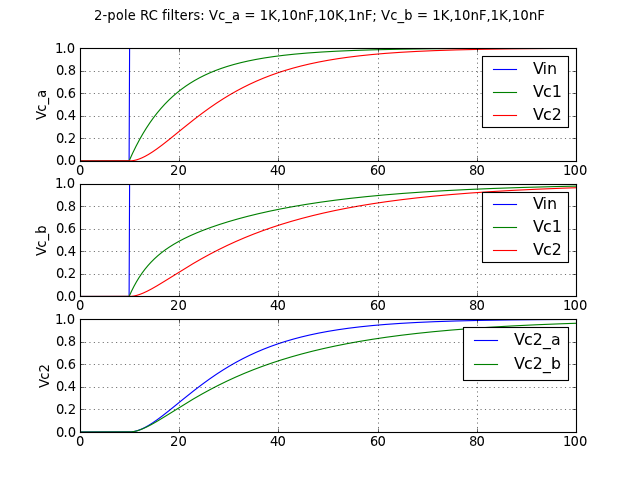
Again, here’s the short source code:
import matplotlib.pyplot as plt
import numpy
import itertools

# array version of the zip() function
def azip(*args):
  iters = [iter(arg) for arg in args]
  for i in itertools.count():
    yield tuple([it.next() for it in iters])

# special case for 2 args
def azip2(a1,a2):
  it1 = iter(a1)
  it2 = iter(a2)
  for i in itertools.count():
    yield (it1.next(), it2.next())

def rcfilt(t,Vin,R,C):
  N = len(C)
  Vc = [0]*N
  tprev = None
  for (tj,Vj) in azip2(t,Vin):
    if tprev is not None:
      I = [(Vj-Vc[0])/R[0]] + [(Vc[k-1]-Vc[k])/R[k] for k in range(1,N)] + [0]
      dt = tj - tprev
      for k in range(N):
        Vc[k] += (I[k]-I[k+1])/C[k]*dt
    tprev = tj
    yield numpy.array(Vc)


# 0-100 microseconds
t = numpy.arange(0,100,0.1)*1e-6
tus = t*1e6
Vin = (tus >= 10) * 1.0

# R1 = 1kohm,  C1 = 10nF
# R2 = 10kohm, C2 = 1nF
R = [1000, 10000]
C = [10e-9, 1e-9]
Vc_a = numpy.array(list(rcfilt(t,Vin,R,C)))

R = [1000, 1000]
C = [10e-9, 10e-9]
Vc_b = numpy.array(list(rcfilt(t,Vin,R,C)))

fig = plt.figure(figsize=[8,6], dpi=80)
ylabels = ['Vc_a', 'Vc_b']
for (k,Vc) in enumerate([Vc_a,Vc_b]):
    ax = fig.add_subplot(3,1,k+1)
    ax.plot(tus,Vin,tus,Vc)
    ax.legend(['Vin','Vc1','Vc2'])
    ax.set_ylabel(ylabels[k])
    ax.grid('on')

ax = fig.add_subplot(3,1,3)
ax.plot(tus,Vc_a[:,-1],tus,Vc_b[:,-1])
ax.legend(['Vc2_a','Vc2_b'])
ax.set_ylabel('Vc2')
ax.grid('on')

fig.suptitle('2-pole RC filters: Vc_a = 1K,10nF,10K,1nF; Vc_b = 1K,10nF,1K,10nF')
fig.savefig('rcfilt1.png',dpi=fig.dpi)
plt.show()
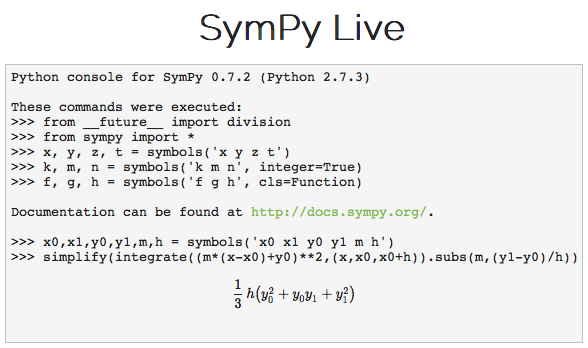
Or using the sympy symbolic algebra package for Python to compute the mean squared value of a piecewise linear segment:
from sympy import *
x0,x1,y0,y1,m,h = symbols('x0 x1 y0 y1 m h')
simplify(integrate((m*(x-x0)+y0)**2,(x,x0,x0+h)).subs(m,(y1-y0)/h))
You can even try this yourself on the SymPy Live server:
Installation
The core Python installation is pretty easy; OSX users have Python installed right out of the box, but no matter what your OS, there are precompiled binaries on python.org. Things get a little trickier if you want to install the scipy/numpy/matplotlib libraries without relying on having the right compiler environment installed.
There are some good solutions listed on the scipy.org website; I thought I’d share my own experiences as well. I don’t have experience using Linux so check the scipy.org page.
Windows
There are three free prepackaged versions of PyLab that I’ve used:
PortablePython had the most reliable install/runtime. PythonXY has the largest feature set (and the largest install size). Enthought Canopy is nice; Enthought offers a free version to try it out, and if you want more libraries included you can purchase a non-free version — their earlier distribution, EPD, was a little easier to run from the command-line and I’m not sure how to do it reliably yet with Enthought Canopy.
There’s also Anaconda, which I’ve just started using on Mac OSX, but haven’t tried on Windows yet.
Mac OSX
I’m running Snow Leopard (OSX 10.6) on my Mac at home. I haven’t found a great solution for PyLab yet but am working on it.
The easiest free install for PyLab appears to be Anaconda. from Continuum Analytics. The install was easy, and it just works… except I got some warnings about memory allocation when I ran the scripts I wrote for this post (the scripts did work properly, though), and when I went to run my regular Python installation, my matplotlib install was screwed up. Grrr. Hopefully these kinks will get straightened out; Anaconda looks very promising.
The usual free-software process on Macs uses package managers like fink or MacPorts; the MacPorts process (sudo port install blahblahblah… from a command terminal) is kind of brittle, and if you have something wrong with your setup, the whole process comes to a halt, with a cryptic message.
Enthought Canopy has OSX and Linux versions out there as well, but I haven’t tried it yet.
It’s also possible to use precompiled binaries out there for the various packages. Although Python comes pre-installed on the Mac, make sure your version of Python is compatible with the libraries you install. I’d recommend installing an up-to-date version of Python as well. At a minimum, here’s what you need:
MATLAB vs. Python
Reasons to use MATLAB
- It’s well-respected software, head and shoulders above other competitors
- Simulink has no real alternatives
- It has fast matrix math, a good debugger, and special syntax to facilitate numerical analysis:
- array slices:
A(:,5:10) = 33; - sequence creation:
B = [1:3:30]; - array concatenation:
Brepeat = [B, B, B]; C = [B; B*2; B.*B];
- array slices:
- GUI tools like SPTool (for general signal visualization and filtering) or FDATool (for digital filter design)
- For high-quality professional-grade signal processing and control systems design
Reasons not to use MATLAB
- It’s expensive for individual licenses! A copy of the core MATLAB is US\$2150 at the time of this writing. That’s not so bad in a corporate environment, but multiply that by the number of people who need to use it, and all their other toolboxes are sold à la carte.
- It’s expensive for group licenses! A network-licensed version of MATLAB or any of its toolboxes costs 4x as much as a license for an individual PC. I can’t say I’ve ever seen a bandsaw or lathe for sale with two prices, one for individual use, and one which costs 4x as much if you want to share it among several people. At my old company we had 7 network licenses of MATLAB, with 40 or so people using it on various occasions — so for the core MATLAB program, it was worth the cost, but the toolboxes were rarely used, so we couldn’t justify purchasing more than 1 license of the toolboxes, and in some cases we couldn’t justify the toolboxes at all. I would have loved to be able to use the Matlab compiler, but a network license was just too pricey. Other software programs offer network licenses with multipliers in the 1.25-2.0 range, to justify the added convenience of being able to share it among multiple people as long as they don’t use a license simultaneously, but The MathWorks is the only company I’ve ever seen that uses a 4x multiplier.
- It’s expensive to get toolboxes just to use one feature on rare occasions! So you need some curve fitting tools two or three times a year? That’s not really enough to justify purchasing a \$1000 Curve Fitting Toolbox. I think what bothers me most is the attitude The MathWorks takes about their toolboxes. They seem to treat their customers as though they all have deep pockets. All their webinars and training sessions promote toolboxes — that part is okay, but they never bring up the cost unless you ask them, and they don’t offer justification that technical staff could use with management to back up a request for the purchase of a \$1000 license. And often there are mundane functions located in the toolboxes that really should be in the core MATLAB distribution. Here’s an example: the
norminv()function is located in the Statistics Toolbox; it’s easily calculated by using theerfinv()function built into MATLAB. But if someone working with you putsnorminv()into their script because they have a license for Statistics Toolbox, then you either have to get Statistics Toolbox, or rewrite their script to useerfinv(). - The syntax is a bit quirky sometimes. Array numbering starts from 1. You have choices of a script file (.m) or a function (.m) that have consequences: Script files can’t have subfunctions, and modify the global environment; function files can have subfunctions, and don’t modify the global environment. If you forget to end a line with a semicolon, it’s not an error, but the MATLAB interpreter will print out a value, and I can’t tell you how many times I’ve wasted 30 minutes trying to find out where that damn missing semicolon is, so I can get rid of the unintended printed value. strcmp() returns 0 for a mismatch and 1 for a match, which is incompatible with the usual C version of strcmp() which returns -1,0,1 depending on which string is first in order. I could go on but I’ll stop.
- Namespace management sucks. You want to keep your control systems gains out of Simulink models (akin to keeping hard-coded constants out of C code and in a separate .h file)? They have to go into the MATLAB base workspace. You can hack the
sim()command into using the calling function’s workspace, but it’s kinda tricky and not compatible with other features of Simulink. It would be soooooooo easy for MathWorks to allow passing in a structure as an argument to Simulink, which is used as the source for all named constant lookups and “From Workspace” blocks. Alas, you can’t do it. Same thing with the “To Workspace” blocks in Simulink, it just spews the results into the top-level workspace, clobbering any variables you might have with the same names. MATLAB does have theassignin()function, but it only has a limited selection of workspaces, and there isn’t first-class workspace support.
Reasons to use Python
- It’s a beautiful, widely used language. Array numbering starts from 0, the language syntax is much better thought out, as is the class system. The module/packaging system in Python is much better than MATLAB’s path. And I happen to like iterators and generators in Python, which aren’t in MATLAB.
- Matplotlib is like MATLAB’s plotting utility, but improved and easier to use.
- You get all the nifty Python libraries as well. Opening files, iterating over directories, etc. is all easier.
- If you want a MATLAB-like environment, you can use the IPython (interactive Python) shell, which includes goodies like tab-completion, debugging-on-error, and “notebooks” to record your exploration.
- The numpy/scipy/pandas libraries are comparable to MATLAB plus a bunch of toolboxes. For instance, I was recently able to work with some cubic-spline-fitting functions of scipy. I wouldn’t have been able to do the same thing in MATLAB unless I had the Curve-Fitting Toolbox.
- It’s free!
Things you give up when using Python
All of the following issues are caused by the fact that numpy is an add-on library to Python, vs. a first-class feature of the language.
- Array literals aren’t as easy, you have to use
numpy.array([1,2,3])]instead of[1,2,3]if you want full matrix-aware math. - To operate on numpy arrays with elementary functions like
sin()andexp(), you need to explicitly use the numpy versions of these functions. - Array concatenation isn’t as easy, you have to use
numpy.hstackandnumpy.vstackinstead of[A,B]or[A;B]
Want to learn more about PyLab?
First and foremost: try it!
There are some great tutorials on scipy.org. Python is widespread enough that there are also many other tutorials scattered around the internet. Here’s one that I found which looks like a good place to start.
For Python in general, the O'Reilly book Learning Python is a classic — the 5th edition is just about nearing publication, but for the basics, you won’t miss much by getting an earlier edition. There’s also Learn Python The Hard Way, available free as an online series of exercises.
Other resources
I’ve just started learning how to use pandas and IPython.
pandas
The pandas package includes tools for data analysis with Python. The numpy and scipy libraries work with N-dimensional arrays. The pandas library adds named and indexed columns and rows to arrays. If you’ve ever worked with CSV files that have column headers, you know what I mean. Imagine removing the headers from a CSV file: what you have left is a matrix, where you have to remember that column 0 is time and columns 1-3 are motor phase voltage. The pandas library gives you a Python class called DataFrame, which lets you annotate matrices with information about each of the rows and columns. There are a lot of other goodies in pandas.DataFrame for number-crunching on this type of data.
Want to learn more about pandas?
- check out the documentation: it’s got a quick introduction and detailed information.
- get the O'Reilly book, Python for Data Analysis.
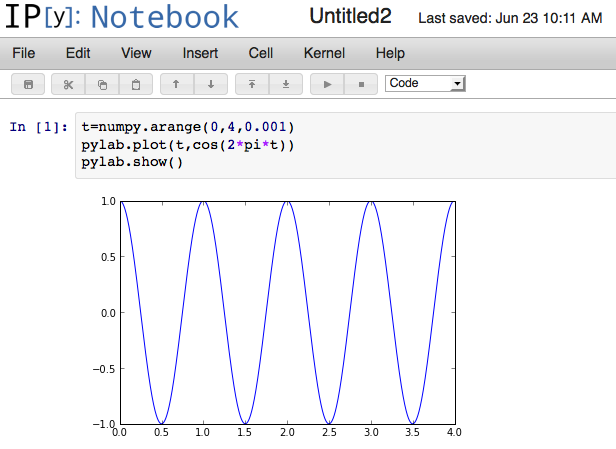
IPython
If you’re used to the interactive shell in Matlab, IPython is for you. If you type ipython notebook --pylab inline it will start a webserver, open up your web browser, and pre-import the pylab libraries:
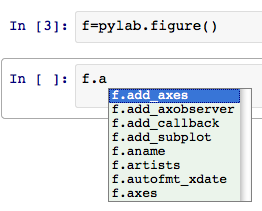
If you forget the methods available from an object, you can just press the tab key to get interactive completion:
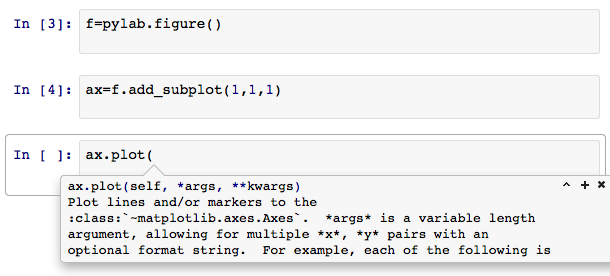
If you start writing a function call and hesitate, IPython will prompt you with some basic help:
And that’s just the beginning. Like I said, I’m still learning IPython. Want to learn more?
- check out the documentation
- watch the tutorial videos
Conclusion
The more I learn about Python, the less dependent on MATLAB I become for the data analysis and visualization tasks I need for my job.
Remember: embedded systems development isn’t just about coding. It’s about planning, in the context of a real system with electronic components and sometimes mechanical components. To make a better system, you can save yourself a lot of hassle by analyzing it before you just start throwing embedded C code at it. Tools like MATLAB and Python can help; if you or the people you work with don’t have access to MATLAB, give Python a try.
And have fun!
© 2013 Jason M. Sachs, all rights reserved.
- Comments
- Write a Comment Select to add a comment
I started out doing scientific programming in MATLAB. Switched to Python because I could not afford the MATLAB license. Then ended up doing web development because of my Python skills. Now I am back to scientific programming at a company that would buy me a MATLAB license, but I am sticking with Python because it does everything I need and helps me maintain my Python skills.

I put a simple example at this chiphacker answer: http://electronics.stackexchange.com/a/68083/411
This is a simplified example. But with not much more code I can generate FIR filters at compile-time with scipy's remez algorithm,. It makes experimentation so much easier.
and use "a([1, 2, 3])" instead of "numpy.array([1,2,3])]", not as good as "[1 2 3]" but inability to use "a" as a variable is a small price to pay for the convenience.

>> x = r_[1,2,3,4,5]
Thank you for the resources, I am making the transition from Matlab to Pylab. Here is one more resource that I have found very useful for learning the python language. https://developers.google.com/edu/python/
This looks interesting, I like Python a lot and am just learning about DSP stuff. But the examples you give look like a better fit for one of the many Spice packages, no?

Perhaps... but I hate Spice. I have never been able to use it for anything more than trivial things, or for homework in a circuits class 20 years ago.
Simulink is something I find easier to use, but it's not free.
I will use Simulink (at work) when I need to, but for just messing around with simple systems I'll use IPython Notebook.
Ha, fair enough. In all honesty I prefer actual components and a scope to any of it. Might well give this a try for DSP stuff though, as I get into it. Looks interesting.
See also scipy.signal.lsim2 which works on LTI objects, which are kind of like Matlab's transfer function objects and state-space objects, but a little more restrictive.
I used this heavily in my exploration of Pade approximations (see https://www.embeddedrelated.com/showarticle/927.ph...).
To post reply to a comment, click on the 'reply' button attached to each comment. To post a new comment (not a reply to a comment) check out the 'Write a Comment' tab at the top of the comments.
Please login (on the right) if you already have an account on this platform.
Otherwise, please use this form to register (free) an join one of the largest online community for Electrical/Embedded/DSP/FPGA/ML engineers:


