


A Remarkable Bit of DFT Trivia
I recently noticed a rather peculiar example of discrete Fourier transform (DFT) trivia; an unexpected coincidence regarding the scalloping loss of the DFT. Here's the story.
DFT SCALLOPING LOSS
As you know, if we perform an N-point DFT on N real-valued time-domain samples of a discrete sine wave, whose frequency is an integer multiple of fs/N (fs is the sample rate in Hz), the peak magnitude of the sine wave's positive-frequency spectral component will be

where A is the peak amplitude of the time-domain sine wave. That phrase "whose frequency is an integer multiple of fs/N" means that the sine wave's frequency is located exactly at one of the DFT's bin centers.
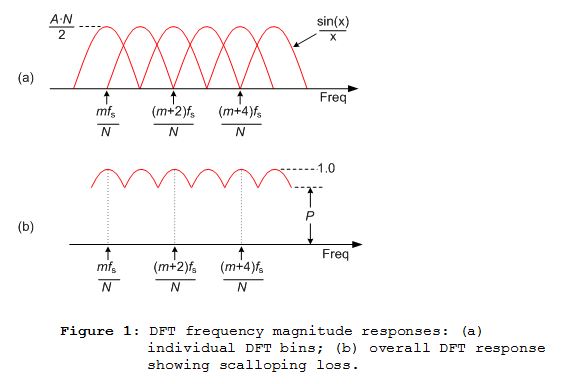
Now, if a DFT's input sine wave's frequency is between two DFT bin centers (a frequency equal to a non-integer multiple of fs/N) the DFT magnitude of that spectral component will be less that the value in Eq. (1). Figure 1 illustrates this behavior where the variable m is the integer index of the DFT's bins. Figure 1(a) shows the frequency responses of individual DFT bins where, for simplicity, we only show the mainlobes (no sidelobes) of the DFT bins' responses.
What this means is that if we were to apply a sine wave to a DFT, and scan the frequency of that sine wave over multiple bins, the magnitude of the DFT's largest normalized magnitude sample value will follow the curve in Figure 1(b). That curve describes what is called the scalloping loss of a DFT [1]. We represent the maximum scalloping loss by the variable P. (I believe the word scallop originated from the shape of the seafood we sauté with butter and garlic. As it turns out, some window drapery, and table cloths, do not have linear borders. Rather they have a series of circular segments, or loops, of fabric defining their decorative borders. Those loops of fabric are called scallops.)
The Trivia
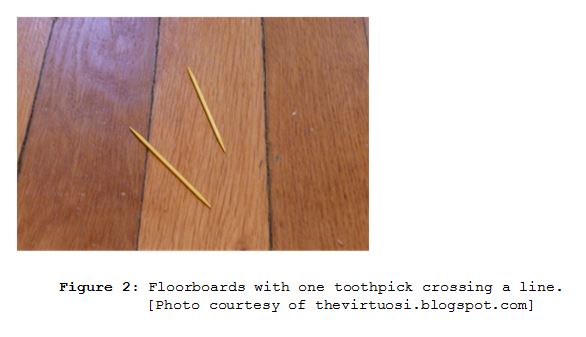
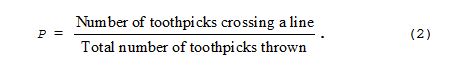
The peculiar trivia mentioned at the beginning of this blog is that the value P in Figure 1(b) is equal to the probability that a toothpick thrown on a wooden floor will land such that it crosses a line separating the floorboards as shown in Figure 2.
That is, the worst-case normalized DFT scalloping loss in Figure 1(b) is:
The only restriction on the toothpick throwing scenario is that the length of the toothpick be equal to the width of the parallel floorboards.
You might think this blog is a bit irrational. Maybe so, but it's not as irrational as the value P, which is:
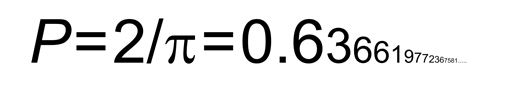
If you are intrigued by this silly DFT trivia, you can investigate Eq. (2) further by searching the web for Buffon's needle.
(Disclosure: No taxpayer money was used, and no animals were injured, in the preparation of this blog.)

References
[1] fred harris, "On the use of windows for harmonic analysis with the discrete Fourier transform," Proceedings of the IEEE, Vol. 66, No. 1, pp. 51-83, January 1978.
Appendix
That interesting constant P = 2/π in Figure 1(b) is obtained as follows:
The frequency magnitude responses of the m = 3 and m = 4 bins of an N-point discrete Fourier transform (DFT), |X(3)| and |X(4)|, are shown in Figure A. The solid curve is the m = 3 bin's response while the dotted curve is the m = 4 bin's magnitude response.
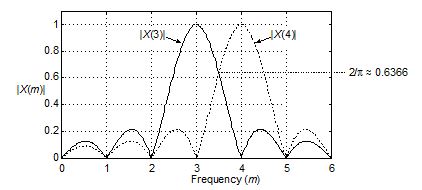
Figure A: Frequency magnitude responses of an N-point DFT.
The solid |X(3)| curve response is represented algebraically by
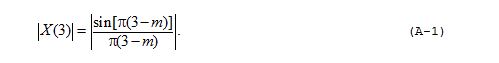
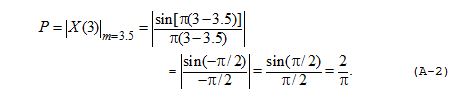
The mainlobe of the |X(3)| curve intersects the mainlobe of the |X(4)| curve at m = 3.5, so substituting 3.5 for m in Eq. (A-1) gives us the value for P as:
- Comments
- Write a Comment Select to add a comment

Ah ha. Such a good question.
I have created an Appendix to this blog that shows the derivation of value P.
(I should have done this before, sorry.) I've asked the web master here (Stephane Boucher) to include that Appendix to this blog. I hope the updated blog is available for viewing in the next few days. Thanks for your comment.
Regards,
[-Rick-]
Did you prove it mathematically? If so it would be very interesting to see the proof because the connection between spectra and Buffon's needle is not evident . If no then you've got the equality experimentally thus it cannot be precise and perhaps it may be just the coincidence and mean nothing.
But of course the the more precise the equality is the more interesting it is...
----------
Maria who wrote you about 'diagonal' convolution calculation scheme (if you remember me)
Thank you for Appendix, everything is clear now. I was intrigued because assumed the proof using the model of Buffon's needle itself. And the point is pi is universal constant and occurs frequently in very different problems.
My mistake is the result of your good joke :)
Regards,
Maria
To post reply to a comment, click on the 'reply' button attached to each comment. To post a new comment (not a reply to a comment) check out the 'Write a Comment' tab at the top of the comments.
Please login (on the right) if you already have an account on this platform.
Otherwise, please use this form to register (free) an join one of the largest online community for Electrical/Embedded/DSP/FPGA/ML engineers:


