


Sine Dipole formation using two hydrophones
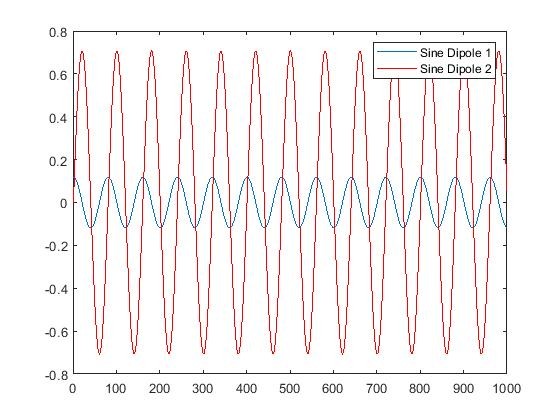
Hi all. I am trying to do MATLAB simulations for generation of SINE Dipole using two hydrophones spaced distance 'd' apart for signal coming from direction 'DOA'. The MATLAB code is given below. The confusion is that there is constant phase difference of 90 degree b/w SINE Dipole generated using difference of two hydrophones and simple SINE Dipole generated by multiplication of signal with sin(DOA). There is also a difference b/w amplitude of two Dipoles. The resultant graph of MATLAB code is also attached.
Am i doing right or something is not right in my understanding?
%%%%MATLAB Code for Sine Dipole Formation
clc
clear
close all
f_sig = 800;%signal frequency in Hz
f_samp = 64000; %Sampling rate
N=81920;%no of data points
c=1500;%sound speed in water in m/s
d=50e-3;%spacing b/w two omni directional hydrophones
DOA=135;%Direction of signal in deg
t=(0:N-1)/f_samp;
lemda=c/f_sig;
Hyd_1=sin(2*pi*f_sig*t+2*pi*(d/2)*sind(DOA)/lemda);
Hyd_2=sin(2*pi*f_sig*t-2*pi*(d/2)*sind(DOA)/lemda);
%Formation of Sinusoidal dipole using two hydrophones Hyd_1 & Hyd_2
Sine_Dipole_1=(Hyd_1-Hyd_2);
%Formation of Sinusoidal by multiplying with sin(DOA)
Sine_Dipole_2=sin(2*pi*f_sig*t)*sind(DOA);
plot(Sine_Dipole_1(1:1000))
hold on
plot(Sine_Dipole_2(1:1000),'r')
Hellol Naumankalia: I am trying to figure out your problem, and a possible solution if I can. The physics of it should be simple enough. Please explain what you mean by SINE Dipole.
Hi Platybel
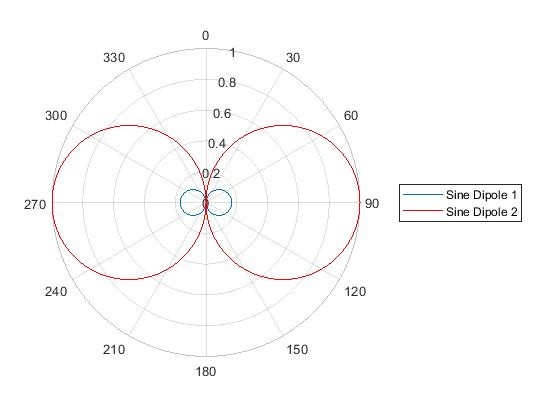
I am calling these SINE Dipoles as they follows sine pattern. If I plot signal magnitude of both Sine_Dipole_1 and Sine_Dipole_2 against angles from 0 to 360, i get following results:
Hello naumankalia: The expression for a monopole is real, but the expression for a dipole has a multiplying factor (j =sqrt(-1), or, -j). This arises out of rather tedious algebra and farfield approximations. Normally, in plots of just the magnitude of the directivity pattern the j factor is not relevant.
You can see the dipole expression derived in Kurt Heutschi Lecture Notes on Acoustics I pp 17 - 18.
https://people.ee.ethz.ch/~isistaff/courses/ak1/skriptA1-english.pdf
The j or -j would account for the 90 deg phase shift that you have observed between Sine_Dipole_1 and Sine_Dipole_2.
Hi Platybel
Thanks very much for help. Will this factor 'j' appears only in simulations due to mathematics? I mean if I do practical experiment by making dipole (calling it Sine_Dipole_3) using two real hydrophones placed 'd' distance apart (e.g. by inverting the phase of one hydrophone and then adding both) and then place a source of say 800 Hz at angle of 135 deg, should i get same 90 degree phase shift b/w Sine_Dipole_3 and Sine_Dipole_2 (Ideal one) as I am getting in simulations?
Thanks & Regards
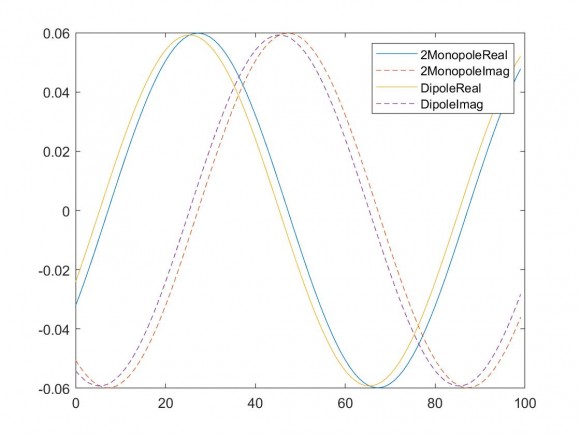
Hello naumankalia: You should recognise that you get (near) identical results, whether you derive the dipole field from two oppositely phased closely spaced monopoles, or from the equation of the dipole field. I have modified your original Matlab code to demonstrate this. Do remember that while the monopole field is real, the dipole field is complex, i.e. has a real and imaginary component.
I have used the equation (1.82) in Heutschi for two monopoles. I have considered the monopoles are separated by d in the horizontal x direction (Heutschi's figure shows the monopoles spaced vertically). For the dipole I have used equation (1.89).
The results are shown in the figure. The blue (2 monopoles) curve and yellow (dipole) solid lines show the real part of the dipole field at a distance r. The dashed lines show the imaginary part of the field.
The conclusion is that you get the same result whether you use for computation the expression for two monopoles or one dipole. Do remember that the two monopole approach does not involve farfield approximations.
I hope this answers all your questions.
cheers
%%%%MATLAB Code for Dipole Formation
clc
clear
close all
f_sig = 800;%signal frequency in Hz
f_samp = 64000; %Sampling rate
N=81920;%no of data points
c=1500;%sound speed in water in m/s
d=50e-3;%spacing b/w two omni directional hydrophones
DOA=135;%Direction of signal in deg
%t=(0:N-1)/f_samp;
t=(0:99)/f_samp;
lemda=c/f_sig;
k=1/lemda;% wave number
kp=2*pi*k;% Angular wave number
omg=2*pi*f_sig;%Angular frequency
r=2 %distance from source
r1=(sqrt((r*cosd(DOA)-(d/2))^2+(r*sind(DOA))^2))%distance from monopole1
r2=(sqrt((r*cosd(DOA)+(d/2))^2+(r*sind(DOA))^2))%distance from monopole2
Hyd_1=(1/r1)*exp(i*(omg*t-kp*r1));%Monopole1
Hyd_2=(1/r2)*exp(i*(omg*t-kp*r2));%Monopole2
Dipole_1=(Hyd_1-Hyd_2);% Dipole field from two monopole fields
Dipole_2=((i*kp*d*cosd(DOA)/r))*exp(i*(omg*t-kp*r));% Dipole from formula
t100=(0:99);
y1r=real(Dipole_1(1:100));
y1i=imag(Dipole_1(1:100));
y2r=real(Dipole_2(1:100));
y2i=imag(Dipole_2(1:100));
figure
plot(t100,y1r,'DisplayName','2MonopoleReal')
hold on
plot(t100,y1i,'--','DisplayName','2MonopoleImag')
plot(t100,y2r,'DisplayName','DipoleReal')
plot(t100,y2i,'--','DisplayName','DipoleImag')
hold off
lgd=legend;
lgd.NumColumns=1;
Hi Playbel
Many many thanks for help and also for 'MATLAB Code'. What i conclude from your last reply is that in practical field using real hydrophones as two monopoles, i should not worry about 'j' term as it is only due to the way i simulated the monopoles data in my first post (in contrast to your way of simulating data in which both Dipoles phases are aligned). Kindly correct me if i am wrong.
Thanks & Regards
Hello naumankalia:
Your original question was that you are interested in determining the directivity function of a two element hydrophone array, with opposing phases.In determining the response of a hydrophone (receiver) R, located at or near the origin, O, to a source S, located at A, a distance r from the origin O.
It is easier to solve this problem, with the source and receiver locations interchanged.So in solving this we locate a monopole at the origin O, and the receiver at A.The solution for a oscillating monopole already exists in the literature.
We write the receiver at r from the monopole will see a wave:
M=(1/r)(exp(i(wt-k r)(1)
where i=sqrt(-1); w=2 pi f; kpi= 2 pi k, f is frequency, k is the wave number.
Just by substituting the values of f and k, you can compute the signal seen at a receiver a distance r away from the monopole.
If the signal at distance is too low, we can increase by using two hydrophones (in phase), and just adding the outputs.Assume that is hydrophone is located at distance d/2 from the origin, on the x axis.Here we use two in phase monopoles
M2=M+M=(1/r1)(exp(i(wt-k r1) + (1/r2)(exp(i(wt-k r2), (2)
where r1 and r2 are the distance of the receiver from Monopole1 and Monopole2 respectively.Here r1 and r2 can be computed with simple trigonometry.Do remember that the results are valid for a source at A, and two hydrophones near the origin.
The 2 inphase monopoles are just the beginning of receiver arrays or source arrays. Interesting things happen when we adjust the relative phases of the hydrophones in the array.We are able to make the hydrophone array sensitive to signals coming from one direction, and insensitive to signals from other directions.We can begin to see the advantage of phased arrays, the control of directional sensitivity.
We construct a Dipole from two monopoles with opposing phases.So
D1=M1-M2; (3)
Notethat to indicate opposing phase, we simply subtracted M2 from M1.For (2) both M1 and M2 are inphase. So the they are simply added.
You can compute the response with matlab for multi hydrophone arrays just using expression (1), and using appropriate values for r1, r2, r3, r4 etc.However, often a simpler, more compact expression, if available, is used.It saves on computation, and, being compact, is easier to debug.In the matlab script I used (3) and D2, the compact expression for a dipole, eqn (1.89) on p18 of Heutschi at https://people.ee.ethz.ch/~isistaff/courses/ak1/skriptA1-english.pdf.
The problem that you posed on this forum was that when you computed the dipole field using (3) above, and the compact expression for dipole, you got different results.That is because the expressions you used were incomplete, or incorrect.What I demonstrated for you was that with the use of correct expression both approaches give similar results in the far field.
From your last comments I get the impression that you are not familiar with complex numbers (or quadrature component of a signal).Different disciplines have different terminology and different symbols.In the sciences it is common to use ‘i’ to denote sqrt(-1), while in engineering it is ‘j’.If unfamiliar with complex quantities, I strongly suggest that you read up or brush up.A very readable writeup is by Richard Lyons at https://dspguru.com/files/QuadSignals.pdf
Since both D1 and D2 give the hydrophone output as a complex expression in the time domain, with a real part and an imaginary part, what will the hydrophone ouput look like?The hydrophone output will be a sum of the real part and the imaginary part.
You can add two lines to the matlab program to see the hydrophone array output:
d1 = y1r + y1i;
d2 = y2r + y2i;
If you plot d1 and d2 you will see they are very close.
Caution:Normally you would not be able to add and get a meaningful result by adding the real and imaginary parts of a complex number.Here we are able to do this because we are using a physical sensor (hydrophone) that senses all the phases of a signal together.
I hope I have been able to clarify all your querries.
Hi Playbel
Many thanks again for such detailed elaboration as well as literature. You correctly pointed out that the expressions used by me were incomplete, or incorrect in my simulations that's why i got different results.
Thanks & Regards

Nauman-
If the signal source is not equidistant from the hydrophones, wouldn't you expect an amplitude difference ?
-Jeff
Hi Jeff
I meant that the SINE Dipoles made using two methods should have same amplitude and phase relative to each other. In my understanding, both methods of Dipole formation should be equivalent.
Nauman-
Yes but you have DOA set to 135 deg. That does not sound like equidistant to me. What happens if you move DOA around ? Does your amplitude vary ?
It "feels" to me like you may have some basic setup issues or assumptions that are not holding up. That's why I'm suggesting to try some configurations where you know exactly what to expect, such as equidistant source signal. Also you might try a single pulse as a source, so you can exactly compare hydrophone arrival times. That's harder to do with steady state sinewaves.
-Jeff
Hi jeff
The second graph i shared shows the variation of amplitude when angle changes from 0 to 360 deg (following sine pattern).
Currently, I am doing only simulations (no experiment) to generate SINE Dipole using two methods. In first method, I am simulating a SINE Dipole using difference of two omni directional hydrophones which i call Sine_Dipole_1 and in second method, i simulate SINE Dipole just by multiplication of sinusoidal signal with sin(DOA) calling it Sine_Dipole_2 .MATLAB code for these two simulations is being presented in my first post.
In my understanding, both simulation methods should generate exactly same output but this is not the case (as apparent from two graphs presented) which means there is some issue in my simulations or in my understanding?
Nauman-
My apologies I didn't realize your dipole plot is showing amplitude. In that case, why would amplitude for both hydrophones be zero at DOA = 0 ?
That makes no sense. If you have this:
s
/ \
h1 h2
and s is a sinewave, then amplitude at both h1 and h2 should be identical, correct ? If s moves left or right, then one might expect amplitude to vary slightly, assuming some slight amount of attenuation over the greater distance traveled. But nowhere in your plots or code do I see this.
-Jeff
Hi Jeff
It is not the amplitude of two hydrophones i am plotting in Dipole graph, it is the amplitude of two Dipoles formed using two methods i mentioned before.
At 0 degree DOA, both hydrophones will receive same signal without any phase or amplitude difference, so when Dipole is formed using difference of these two hydrophones, its output should be zero (cancel out)
Nauman-
That sounds good, but in that case you are relying on assumptions that remain unverified -- at least to me, and I would suspect many others viewing your question, due to the limited number of replies.
My suggestion is to first verify your basic model, and show that yes, in fact moving s from side-to-side produces amplitude and phase differences at each hydrophone that make sense. So far I've not seen that, which makes me less inclined to carefully go through your dipole code + analysis.
-Jeff


