


I have some frequency domain data and I want to try to construct the proper vector for IFFT'ing to get an impulse response. In the current case, I have a starting vector, sampled from 0 to 140Hz, every 0.5 Hz, vector length of 281. For purposes of compatibility to previous data, I would like to get a 1 second IR, 560 samples (I'm only interested in low frequencies here). Given the frequency bin spacing, if I do the usual method and assume Fs = 280 Hz, and use FFT size of 560, I get a 2 second IR with 560 samples. Too long. So, I double the FFT size to 1120, and double the assumed Fs, giving a 2 second IR, with 1120 samples. I can truncate this to 560 samples. The issue is that I now need to fill in the complex frequency values between n = Fs/4 and Fs/2+1, to set up the IFFT. Should I put zeros in there? Or take the last value, at n = 281, and replicate it up to n = 561?
I have been playing around with this and it sort of works but the IR looks "funny". It seems to have a pre-ringing, and just does not look like the IR's I got previously using different methods. This seems to come up fairly regularly. I'd be interested in any general suggestions and "gotchas" that others have found, when it comes to constructing proper vectors for IFFT'ing. For example, making sure that the values at Fs/2+1 is real, not complex. That sort of thing.

I would try mirroring the data so you have samples 0->280 followed by 280->0. Since it's in the frequency domain that's equivalent to positive and negative frequencies being the same. That should give the impulse you want, but maybe with double the amplitude.
I've been beating my head on IFFT's a bit trying to get a nice step response from the integral of the impulse. The units are driving me crazy. I don't worry about the length of the response so long as it gets to the end of my physical structure. After that I just ignore it.
I've done this a few times over the years (I used to do it more often), and it always seems like there ONE bin off somewhere that screws it up. For years, I just did all my work in magnitude domain and used Hilbert to get me a min phase IR at the end. For the work I was doing, it was acceptable. So much simpler!
Looks like you have an odd number of samples in the f domain. sample s1=f0 denotes the DC term. Then samples s2 to s281 represent s2=0.5Hz to s281=160Hz. I am assuming that your time domain data (IR) is all real (no imaginary components). To use the IFFT, the f domain data must have odd FFT symmetry (slightly different from even fft symmetry).
For odd symmetry the conjugates of s2 to s281 are mirrored over s282 to s1121:
s282 = s281* ; s1121 = s2*. s1=f0 is not duplicated.
Length=1121
Most common FFT programs will handle both odd and even length series without problem. The only assumption you are making is that the time data is all real. There is no need for any zero padding.
You can easily observe the even and odd FFT symmetry by applying FFT to a 8 point and then a 9 point all real time data and observing the symmetry/ anti symmetry in the f domain.
PS: I have had second thoughts. I assumed that the length of your time series is odd length. But I realised that I have no basis for such an assumption. So please try also for even length symmetry.
For Even length:
s282=s280*, s283=s279*.......... s1120=s2*; s1 and s281 are not duplicated/mirrored.
Length=1120
Then you apply IFFT.
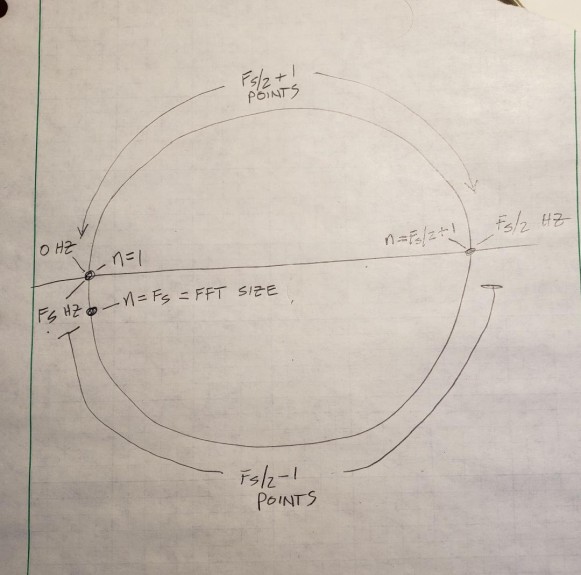
I may not have been clear as to when I was talking about frequency values or indices. In my zero padded version (yes, not required except I wanted to get more samples in time), I was starting with 280 freq bins, then proposing an 1120 Hz Fs, and constructing a vector which is zero padded up to 561 freq samples. Then my script will construct the final "full" vector up to 1120 samples, by flipping and conjugating the first part. That part is from freq 0-Fs/2 and freq indices 1 to Fs/2+1 = 561. I made myself a handy visual aid. I'm sure this is pretty basic stuff to you guys, but it helps me keep track of frequencies vs indices .
Thanks for the sketch. It made things a bit clearer. But I need to understand some terms before I can give you an answer to your original question. FFT is a computer program. What do you mean by FFT size? What is Fs? What is a 2 second IR? What is a 1 second IR?
For Fourier Transform, whether for FFT or IFFT, properly placed zeros in one domain results in interpolation in the other domain. You are zero padding in the f domain. That interpolates between the points in the t domain, but does not give any new information. It simply gives the illusion of a longer dataseries.
Anything other than properly placed zeros will distort the results in the other domain.
I was maybe being a little loose with terms. I really mean a DFT, Im just used to calling it FFT. You could calculate it in several different ways, FFT being one of them. IR is Impulse Response. So adding zeros in freq domain, does give more points in time domain. But you either get a longer IR (if you keep the same Fs (sample rate)), or interpolated IR of same length (if you increase Fs in accordance with the added zeros). At least, that is my understanding. So, you could have a 2 second IR, the first second of it exactly the same as before but just extended out to 2 sec, OR a 1 second IR, with twice the number of samples in the original 1 second (i.e. interpolated). It depends on the sample rate. In my case I don't have a fixed sample rate, since there is not actual, physical system that I'm using. It is all mathematical. That is part of what was confusing me.
1. Let us your data series in the f domain is 1+N/2 points long. You add the conjugate mirror points to get N points. Lets call this H
2 Apply IFFT to the N points in H in the f domain, obtain N points in t domain (your IR). lets call this h
3. Next zeropad H, so you have N+M points. Lets call this Hm,
4. Apply IFFT to Hm, giving hm.
5. hm has M points more than h. But these new points are NOT new information in hm. They are interpolated, between the known N points of h. Although in plots your IR may look stretched, or over a longer time span, the zero padding in the f domain has increased the number of points in the f domain, and in the t domain. In the t domain the time interval between the points has shrunk. Your Fs has automatically changed.
With zero padding in either domain the sample interval is inevitably adjusted in the other domain.
OK, so if you zero pad, then Fs is increased proportionately, and, yes your IR has more points, but higher Fs = same length. But, if you add more points in the FFT without increasing Fs, i.e. you interpolate in f domain, you will get more points but same Fs in your IR, thus longer IR. Right? You are actually adding to the end of the IR, which longer IR corresponds to higher resolution (smaller bins) in freq domain.
Zero padding is easier to understand for going from time > frequency domains. Zero padding is adding more points, just that they are zeros.
The sample interval in f domain, df is determined by T, length of the data set. T=M dt, where M is the number of points in the time series, and dt is the sample interval. You can determine Fs, the sample rate, when you specify the time units. Thus 1 sample/sec = Fs = 1Hz.
FFT requires no time unit.
In the f domain, the lowest frequency is the zero frequency, DC term. The highest frequency is the Nyquist frequency, fNq= 1/(2 dt).
The sample spacing in frequency domain, df= 1/(M dt).
If you add non-zero points in the time domain, the shape of the spectrum in the f domain will change. But the frequency of fNq does not change.
Zeropadding in f domain is slightly more complicated, but the same concepts apply.
If you still have questions, you can ask again. Better still you can consult one of the free books by Julius Smith, on DSPRelated website. They are well written, in simple language, and easy to follow.
Got it, thanks. Interpolating in one domain is zero padding in the other. I haven't thought about this stuff for a ling time!
I thought of another viewpoint that is (I think) is simpler.
When you add even a single zero point in the f domain (and mirror it), you are also increasing the Nyquist frequency, even though it has zero amplitude. This is because the highest frequency in the f domain is the Nyquist frequency.
Since fNq=1/(2 dt), this implies a decrease in the t sample interval dt. The sampling frequency in time domain, Fs, will also be adjusted automatically.
Yes, but only if your freq bin size didn't change. I made some plots in Matlab. Starting with a short section of sine wave:
Zero padding in f domain gives the expected result in time domain, i.e. interpolation. X axis is samples here, not time.
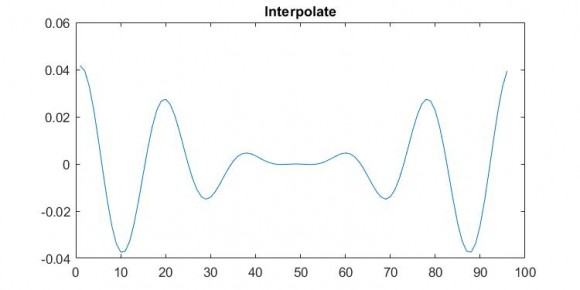
Interpolating in freq domain, however, did not exactly give me zero padding in time domain. I get:
not sure why.
Here is my code:
b = [0 0 1 0 0 0 0 0 0 0 0 0 0 0 0 0 0 0 0 0 0 0 0 0 0]'
bi= [0 0 0 0 0 0 0 0 0 0 0 0 0 0 0 0 0 0 0 0 0 0 0 0 0]'.*i;
b = b+bi;
Fs = 2*(length(b)-1)
figure(10)
plot(ifft(makefull3(b),Fs))
title('Reference')
Fs2 = 2*Fs
c = b;
c(Fs+1) = 0 %zero pad
figure(20)
plot(ifft(makefull3(c),Fs2))
title('Zero pad')
d = interp1(b,[.5:.5:Fs/2+.5],'pchip')
figure(30)
plot(ifft(makefull3(d),Fs2))
title('Interpolate')
function[out] = makefull3(x )
x = x(:)
out = [x; conj(x(end-1:-1:2))];
end

I don't expect "zero insertion duality" between frequency domain & time domain.
For the case of zeroing frequency data (in the middle) it implies wider stop band for same signal bandwidth. Physically you need to apply higher sampling rate to read ifft output and this means upsampling and new samples generated for you.
Upsampling frequency domain data by interpolating new values implies new frequency content and wider band so you don't get zero gaps in the time domain signal but a new unknown signal.
The relationship between zero padding in t(or f) domain and interpolation between points in the f( or t) domain is exact. Duality must hold.
One can look upon the zeropadding operation as slightly modifying the time series (in t or f domains) without increasing (or decreasing) the (a loosely defined) information content. By adding zero points in say time domain, you are pretending that your dataset is longer. But in the f domain, df, the interval between frequency samples, is smaller. The new interpolated values are computed from the same old known sampled points. Thus except for adjusting dt or df, no new information is added. Zero padding gives you the same old data set, but in a slightly different presentation, with no new information added.
I worked out sometime back (buried in notes somewhere) the equations governing zeropadding in t and interpolation in f. It is exact. I have not done it f to t. But it should also be exact.
we are talking different reverses(FD=frequency domain,TD=Time domain)
insert centre zero in FD => upsampled(interpolated) signal in TD
reverses:
A) upsample(interpolate) in TD => extra centre zeros in FD
B) append zeros in TD => just changes resolution of FFT
C) insert zeros regularly between TD samples => copies of band in FD
D) upsample of FD(interpolate) => new strange signal in TD, not zeros, weird operation as it doesn't make sense, may be ok for research
This thread started with discussion of zeropadding in the frequency domain and the consequent interpolation in the time domain. The usage of the term 'interpolation' here is quite general.
As far as I can understand, the term 'interpolation' has a slightly different connotation in hardware circuit discipline. The term 'interpolation' is attached to the operation of upsampling, i.e. insertion of zeros inbetween sample points.
The interpolation in upsampling in time domain is well established. I am guessing that the upsampling in the frequency domain should be interesting. I intend to look into it. Thanks for alerting me.
DSP terminology is not standardised and its community follows their corners, tools and function names.
The case of resample, upsample, oversample, undersample, downsample, interpolate ...etc shows it.
upsample I think means create samples and insert in between known samples as if we are emulating adc that was sampling less. such new samples are interpolated across a number of existing samples. So interpolation is the mechanism of creating new samples
But new samples may be just calculated for the purpose of fractional delay with/without upsampling.
You can interpolate by whatever way. zero insertion is common methodology in hardware. It does not interpolate as it is just zeros leading to copies in FD. When followed by filter to remove copies you get interpolated new values derived from all neighbours with weights decided by filter.
Another example is modulate. Basically anything is a modulator...almost from box level to its office to its internal mixer, multiplier or even constellation mapper.
One can interpolate by several methods. The interpolated points by different methods give similar, but not identical results. When referring to interpolation in the context of FFT, the interpolation is by summation of the sinusoids and cosinusoids, not by any of the other interpolation methods, such as interpolate1.
Can you explain what you mean? If you are interpolating complex numbers in f domain, you can do linear (default in Matlab) or nearest neighbor or other like spline (I used that). I guess you could also do geometric averaging?
Basically we have a set of digitised samples separated by gaps.
h = h(x0),h(x1),h(x2),...............h(xn)
If one wishes to compute the value at a point xu within a gap between xk and xk+1, one has to decide on the analogue function (curve) that connects the two known points h(xk) and h(xk+1) on either side of the gap. One can read off the value on the curve corresponding to the point xu.
Possible assumptions are:
(a) the connecting curve is a straight line joining h(xk) and h(xk+1);
(b) the connecting curve is a fitted curve, a polynomial through all points of the time series;
(c) the connecting curve is a locally fitted curve (spline) passing through neighbouring points of xk and xk+1;
(d) the connecting curve is the sum of fitted sinusoids passing through all points of the time series, a Fourier series. The only way to compute the curve is through FFT or IFFT.
Each of the assumptions will give a different value at any given point within a gap. With zero padding you implicitly follow assumption (d).
Sounds right. In my case I was interpolating if f domain though. I expected to get zero padding in time.
Unfortunately my figures that i inserted in one of my previous posts did not stay in the post. The zero padding in f domain looked like interpolation in time. But, the interpolation in f domain looked a bit weird. I'll try to insert that figure:
again here
If I understood your request:
insert [s0 as dc bin, samples 1:280 as positive bins, 560 zeros, samples 280:1 for negative mirror]. do ifft and you will get upsampled time domain (by 2), decimate by 2 if required.
Yes, I ws trying to figure out how to do it without needing to decimate, but in the end it is simpler to just do it that way!


