


Hello Dear Forum Users,
I am analyzing 2.4Ghz FHSS signal, sampled @40Mhz using USRP.
The BW of each hop is 1Mhz.
Would like to derive several parameters, based on the recordings, among them:
- Modulation(GFSK, FSK, QAM,…).
- Hopping Frequencies and pattern.
- Packet Structure(Preamble|Sync_Word|Address|Payload|CRC?).
- Synchronization Method(Based on Slow and Fast hopping during synchronization and an Acks from the receiver during the conversation phase?).
I am interested to determine the modulation based on the recording of a single burst in the beginning of the transmission (might be during Fast Hopping period).
After down converting the signal and examining in time domain, expected patterns(GFSK, FSK, QAM...) were not spotted(correlating with different segments was used, but yielded a large keys list).
Would be glad to have an advise on the issue.
Matlab Data Structure of a several burst (I+Q) can be seen at:
https://www.dropbox.com/sh/qtvxmri5rv8vya2/AABdWboG1ydgKUxWSa7o5blza?dl=0
Can be loaded using:
strct=load('E:\....\fhss_1.mat');
FHSS_1=strct.fhss_1;
Many thanks in advance.

Hi SenSen,
Your modulation looks like OFDM.
I simply looked at the fhss_1 data. It is sitting at about 29e6 based on the 40e6 sampling rate that you mention.
I modulated down to baseband and simply plotted the magnitude (abs()), and I can see several early segments that are symmetric in time. The very first repeated sequences are short an are probably set that way to allow for Carrier Offset estimation beyond one bin of the FFT.
The next few symmetric patterns are usually the correlation sequences to retrieve the timing phase and to do channel estimation.
I have not yet determined the FFT length and the cyclic prefix length, but these are easy to determine with just a little more effort.
If you would like further help, I am happy to contribute.
Best regards,
David Shaw
Hi SenSen,
A little more digging verifies that the correlation sequence pair that is usually allocated early - for fine frequency estimation and fine timing alignment - definitely exit.
I selected (very roughly) samples in the range 6864:10550 as the first sequence of the pair and then ran a correlation. Two very distinct peaks can be seen. The phase rotation between them can be used to estimate the offset that I did not take care of with my eyeballing of the carrier offset of 29e6 stated previously.
The distance between the correlation peaks is 3656 samples, which will be the length of the FFT plus the prefix. This information, and some observation of the actual bandwidth of the baseband signal should point you to the best down-sampling rate to arrive at a pow(x,2) FFT length. The prefix is very often 1/8 or 1/16 of the FFT length.
Best regards,
David Shaw
Thank you for the detailed and very helpful answer.
P.S.
Seems to me that there are 3 short consecutive sequences(length of 913 each).
Hi SenSen,
You are correct that there appear to be three copies of the short sequence.
Careful review will show that the third is in fact a reflection of the back of a longer sequence which I will call L1.
So we have S1, S1, L1, L2, L2, Li, Li+1, ... , Ln.
L2 is duplicated to significantly improve the correlation properties and thus provide the best possible acquisition of synchronization and channel estimation parameters.
Starting from Li ... are most likely the symbols that contain the data payload for the burst.
I am currently looking for work in this field if you have a need.
Best regards,
David Shaw
Hi David,
Further study of the signal indeed reveals the symbols and the CP.
CP_size = 1/8*Symbol_Duration
Symbol_Duration=3656
However, after LP filtering, down sampling by a factor of 14(floor(3656/256)), applying the FFT(size of 256) and examining the complex result, the expected constellation map is not being witnessed.
Am I missing something?
Hi SenSen,
I have modulated the fhss_2 source by exp(2i*pi*32.99666e6) and resampled it at 5.6e6 Hz and find some very satisfactory results using a 512 point FFT.
Attached is the abs(spectrum) of the L2 Correlation sequence that results. Note that the middle bin is 0 as we would expect for an OFDM signal.
Best regards,
David
Hi David.
Thank you for the reply.
The spectrum is indeed OFDM like, however, the constellation used(QAM4/16/…,) can not be identified.
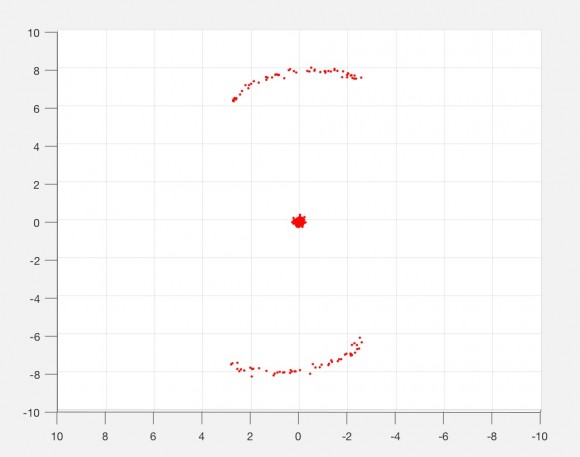
Applying a high resolution FFT(size=2^19), reveals the ~64 bins(Red picks) of the first payload(without the CP) of fhss_1(64bins.png),
however, examining the samples on a complex axis, does not yield a typical constellation/modulation scheme(constellation.png).
Hi SenSen,
I have decoded the first L2 correlation sequence and found 54 subcarriers each side of DC. So there are 108 occupied bins. Each is carrying a BPSK constellation.
I did the frequency offset mentioned above and the resampling to a new rate to get to 512 point FFTs.
Some VERY important items related to OFDM.
1) The main carrier offset compensation has to be very accurate.
2) The length of the FFT has to be precise to "demodulate" the individual sub-carriers to the exact bin positions.
3) The phase relationship between the data chosen for the FFT and the beginning of the symbol must be correct.
a) At 512 point FFTs for 108 used sub-carriers, a single sample offset in the beginning of the symbol is a significant problem, but workable.
b) If the FFT is minimum length (128 in this case) then even the fractional phase of the input samples to the FFT becomes important.
4) There is nothing that can be learned about the constellation from an arbitrary FFT size or starting point. The size and alignment must be exact to have the sub-carriers fall into the right bin positions. The essence of the term "ORTHOGONAL Frequency Division Multiplexed". If the phase, length and timing of the FFT processing is not right, nothing is orthogonal and the sub-carriers are all over each other.
Below is a stereo image plot of the constellation from above. Cross you eyes so that the right eye looks at the left image, and the left eye looks at the right. The image will become 3D. The plot is all the subcarrier phases for the L2 sequence. There are 512 bins, many early and late are 0 level. The 54 before and 54 after the DC bin have positive and negative levels for BPSK. The bin in the middle (single dot) that is 0 is the DC bin. I hope that you can see the 3D visualization. There is still some twist over the bins, which may be either residual carrier offset or some timing offset from incorrect phasing of the FFT WRT the symbol time.
I have also plotted the end on view of the stereo plot. The BPSK of the imaginary vs. the real is simply a constellation phase offset that is arbitrary and of no significance for now.
Best regards,
David

Hello David.
Thanks a lot for the detailed explanation.
Will analyse offline and update soon.
Hi David,
Once again - thank you very much for the highly detailed answer.
I have tried to follow your instructions, however, did not receive the same results.
Wonder what am I missing.
Short document elaborating the process can be found under:
https://www.dropbox.com/s/j7rcyejos2vj0bj/Constell...
Just in case - Relevant code can be found under:
https://www.dropbox.com/s/s2okzesjayqa02n/Constell...
Will be glad to hear your insights on the issue.
Thanks in Advance.
Hi SenSen,
I am working on a more formal reply, but for now, please note above that i was using fhss_2 for my experiments. Your document indicates that you were using fhss_1.
Will respond later.
David
Hello David.
Thank you very much for the help.
In the beginning, the FHSS_2 was examined to be aligned to your answer from January 21, 2017 .
However, according to your previous post, the signal was modulated by exp(2i*pi*32.99666e6).
As I could see(elaborated in the doc above), the Central Frequency of the hop was at ~14Mhz.
As a result, I have mainly concentrated at fhss_1.
Looking forward.
Best wishes.
Hi SenSen,
I apologize for taking so long to get back to you.
Did you get everything figured out?
David
Hello David.
Thank you very much for you interest.
Following our last correspondence on the issue, and thanks to your help, the issue was solved.
The frequency was tuned and the bits from the symbols of the burst extracted.
Further analysis has revealed the existence of additional 3 types of bursts in the recorded signal, with the following characterisation:
1.Rotating Constellation(~1.3[rad] between each consequitive symbol).
2.Bursts without Preamble.
3.Bursts without CP.
These bursts will be analysed in the near future.


