


Hello,
I am sampling, at 192 Khz each channel, a radio signal with a IQ mixer and 2 ADC's. I combine the values into complex numbers. Literature tells that using 2 streams the bandwidth should be the same as the sample frequency. But when I perform a FFT on the samples I get a output from -fs/2 to +fs/2 currently I display the spectrum by only using -fs/2 to 0 bins. But if I want to display the full 192 Khz what should I do. Displaying the full range is just showing an image in the display. Should I first upsample to 384 Khz and then FFT?
Regards,
Paul
Paul, Are the two sampling clocks the same phase and simultaneous? The phase shift between the ordered pair (I and Q) come from the cosine heterodyne and the sine heterodyne. The two channels are the In phase (I) and Quadrature phase (Q). The complex samples are associated with a non-Hermetian symmetric transform. This means that the transform does not have the symmetries we associate with real signals. The real part ien even symmetric and the Imaginary part being odd symmetric. This also means that the spectrum of a real signal has conjugate relationship between posite and negative frequency. This conjugate symmetry is not preent for a complex data signal. This is the reason we have to examine both positive and negative frequency. For real signals H(omega)=conj(H(-omega))... this not true (in general) for complex signals.
the spectrum should be examined from -fs/2 to + fs/2, or from -96 kHz to +96 kHz. youneed to plot the magnitude or log magntude of all bins from -fs/ through 0 to +fs/2
fred h
The clocks are in 90 degree phase. I use a divider to generate phase and 90 degree phase signal. But the answer from Kaz is not correct. The negative frequencies are based on Euler equations, so it is correct that the negative part is like a mirror of the positive part, to calculate the amplitude you have to add them.
So that brings me back to the original question, in the book of R.G. Lyons he states that in case of quadrature sampling you have a bandwidth equal to sampling frequency. But the FFT just shows +/-fs/2. So how to display the complete spectrum, or can I assume that FFT goes from -fs to +fs and ust ignore the devide by 2.

clocks are 90 degrees phase difference???. Never heard of that. You should mix your signal with cos/sin generator on same clock to get I/Q.
Yes, they are. 1 clock at 4 times fs and a divide by 4 to generate 2 clocks with 90 degree difference
That is not IQ demodulator. It just produces delayed copy of same signal. Moreover I suspect your original signal is at dc i.e. real only.
You need to clarify your setup from radio signal, its frequency centre to IQ

Hello Paulho2. To add a few figures to fred harris' (fharris') June 23rd Reply, the below 'Figure a' shows the spectral magnitude samples of a hypothetical real-valued time-domain sequence.
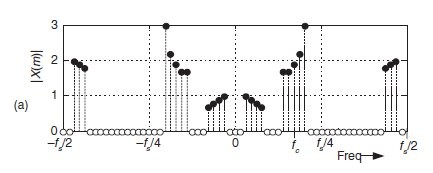
Notice how the magnitude samples are symmetrically centered at zero Hz. (This will be true for ALL real-valued time-domain sequences.) So, in this situation the useful "analysis frequency range" is f_s/2 Hz (zero Hz -to- +f_s/2 Hz) because the negative frequency range provides no spectral information that is not already contained in the positive frequency range's samples. This magnitude symmetry is why spectral plots often only show a frequency range of zero Hz -to- +f_s/2 Hz.
The below 'Figure b' shows the spectral magnitude samples of a hypothetical complex-valued time-domain sequence.
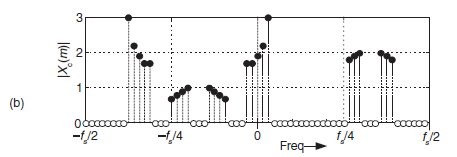
[TO BE MORE CORRECT: In my above material I mention a negative frequency of -f_s/2 Hz. Actually, the most negative-frequency magnitude sample will reside at a frequency of -f_s/2+f_s/N Hz where 'N' is the FFT size (an integer).]
ello Rick,
Thanks for your explanation. So if my fft is generating a mirror image like your first picture I am executing a real value fft? I was expecting to execute a complex fft, i have to do some tests to see if this is the case.
But that brings me back to my original question. Assume I have a complex stream with fs sample frequency. And I want to plot the amplitude of the real spectrum can I then just plot the absolute value from -fs/2 till +fs/2 ? Or should I add the -fs/2 till 0 part with 0 till fs/2 part and have only half the bandwidth available.
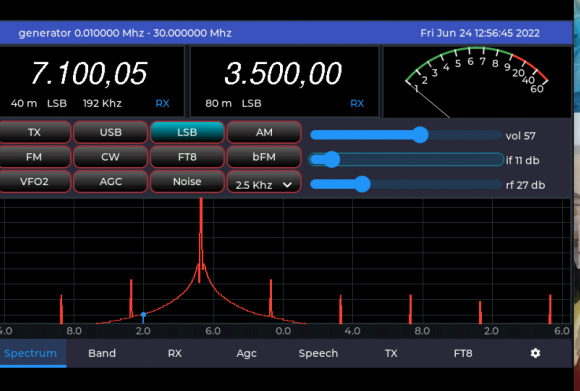
Picture with generated IQ looks like this now. So fft is complex.
Thanks

To see if it's the ADC frontend or the SW processing, synthesize some data and pass it into your SW. If that's OK, then it's a HW problem, otherwise it's SW.
Never fix two (new) things in serial at the same time -- do one at a time.
Yes, you're right. If you do software and hardware at the same time is asking for trouble :)
It was software after all I had to swap the output of the fft.
Thanks everybody for the advise and help.
fft at 192KHz can output 0 to 192 or -fs/2 to +fs/2 depending on fftshift. So what exactly is your issue?
That's not what I see, I only see 192/2 of the spectrum.
If so then either fft is wrong or your I = Q or the difference is too small to observe. can you prove numerically that it is just mirrored.
So in-principle I can display the spectrum from -fs/2 till +fs/2 if the IQ numbers are correct. That is 90 degree phase shift.
yes that is basic fft principle. if your signal Bandwidth violates Fs then it is another issue and fft will show it.
Ok, thanks.
Will do some measurements, maybe something wrong with the IQ signal.
Thanks for your reply.
I think your correct after all
An RF signal centered on Fc will be real only but signal bandwidth of interest carries info from low end of band to high end and so is expected to be asymmetric around Fc.
To demodulate it to I/Q you have two processes to do in one go:
downconvert to dc (or so), this will make it symmetric and you will lose half band. To avoid that you need to downconvert and demodulate with cos/sin at frequency = minus Fc. Each of I and Q will be symmetric but I/Q as complex will not be symmetric and fft will show that.
I don't know about using clock phase to get I/Q but I guess it is meant for something else e.g. force a real sin to be sin and cos. This is not same as I/Q concept.

Are you using a full complex fft, or one that assumes symmetry of the positive and negative spectrums. Many FFTs make the assumption of real valued inputs, such that they can drop the resulting negative frequencies, or at least the plot may be doing that.
Also cross check where the negative frequencies will be stored in the results array - there is likely a 'wrap around' at +fs/2 where the next frequency is at -fs/2 (and there is confusion about fs/2 itself...).
Complex fft, I use liquid dsp for fft which uses fftw3
I'm not familiar with 'liquid'. The fftw3 does work, but the user interfaces can make implicit assumptions that don't match what you expect (true for all implementations)
One test is to create your own dummy data that contains known frequencies, with known I and Q values (and implied phase). See if the program functions then produce those fft outputs.
One feature I like to consider is that, for real signals, negative frequencies can only be 'real' if they are modulations of a carrier.
Also the down sampling of a 4-phase real sample [a,b,c,d] can be done as (a-c, b-d)/2 for the I&Q, i.e. the 'dc' of the carrier [down sampled] is removed.
Hope that helps.
Hello Philip,
Thanks, I think that a good idea. I will make a generator and let it sweep and see what the FFT does. But the reason that I think it is not the IQ signal it self is because I have multiple SDR sources like Adalm Pluto, HackRF, RTLSDR, SDR-Play and my own build, a whole collection and they all generate the same picture. So it must be some software issue or wrong understanding of the process.
Regards,
Paul

Paul, sometimes a picture paints a 1000 words is it possible to post the image up here on what you are seeing?
Leonard.

Similar to lifeatthesharpend's comment of "a picture is worth a thousand words" suggestion, I would second that and double it. By doubling it, I mean sharing an executable reference (code) of what you're inquiring would streamline/focus/expedite the discussion greatly. In English or any human language for that matter, ambiguity is built-in. It's a given. In the universal language of math and engineering, ambiguity melts away and we get to the heart of the matter. It's far more clear, concise, and quantifiable. You'll also encourage participation and get more meaningful responses when working from an executable reference.
And then, yes, add as much surrounding English and visualzations (plots) as you feel appropriate to convey your point/question. This doesn't just apply to your question. It applies to most questions on forums such as this one.
Use whatever language you like C/MATLAB/Octave/Python (any is better than nothing) but MATLAB-based examples will broaden your appeal in the signal processing community.
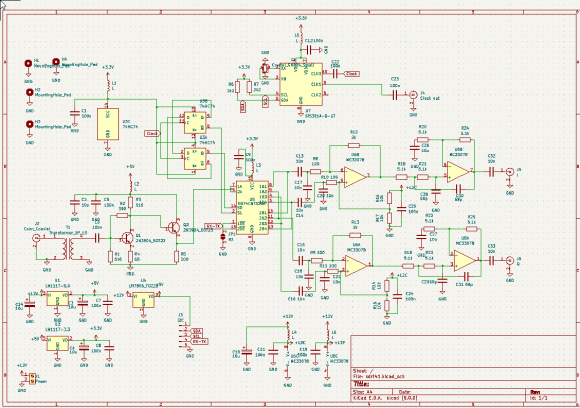
For reference schema of IQ tayloe mixer.
All source code is on https://github.com/paulh002/sdrberry and https://github.com/paulh002/SoapyHifiBerry
#include <fftw3.h>
#include <liquid.h>
void Fft_calculator::process_samples(const IQSampleVector& input)
{
m_input.insert(m_input.end(), input.begin(), input.end());
if (m_input.size() >= nfft)
{
std::unique_lock<std::mutex> lock(m_mutex);
// Apply hamming window
for (int i = 0; i < nfft; i++)
{
m_input[i].real(m_input[i].real() * v_window[i]);
m_input[i].imag(m_input[i].imag() * v_window[i]);
}
plan = fft_create_plan(nfft, m_input.data(), fft_output.data(), LIQUID_FFT_FORWARD, 0);
fft_execute(plan);
fft_destroy_plan(plan);
m_input.clear();
}
}


