


How can I estimate the 2 parameters of this signal?
 Started by 9 months ago●18 replies●latest reply 9 months ago●201 views
I have a digital signal of fixed length (e.g. 100 samples). Somewhere within this signal is a contiguous region characterized by "low variance". The remainder of the signal is characterized by significantly higher variance. I know very little else about the signal.
Here is an example:
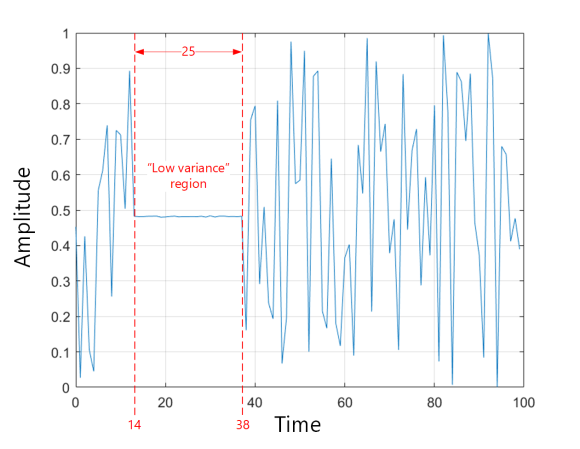
I would like to estimate the start-time and end-time of the "low variance" region. So, in the example above, the ideal outcome would be to estimate that the "low variance" region starts at time 14 and ends at time 38.
My first idea was to exhaustively search (2D) for the start-time \(t_0\) and end-time \(t_1\) that maximize the difference between the variances of the two guessed regions. However, that idea doesn't work well at all. It tends to underestimate the width of the "low variance" region because adding a few edge samples of the "low variance" region to the "high variance" region can increase the variance of the "high variance" region (especially if the two regions have significantly different means).
I also considered maximizing the absolute difference between the means of the two regions, but that fails if the two regions have similar means.
What would be a better algorithm for finding this "low variance" region?

I don't know of any known method for your problem. It seems it is a statistical issue and threshold based so heavily dependent on your signal.
I modelled your vector at random as below (it works but needs correct threshold):
%%%%%%%%%%%%%%%%%%%%%%%%%%%%%%%%%%%%%%%%
x=randn(1,100);
x(14:38)= .5+randn(1,25)*.02;
xx = diff(x).^2; %target zeroing the section
y = filter(ones(1,2)/2,1,xx);
r=find(y < .005);
r'-1
I think we can say quite quickly that no thresholds are required because I can erase the number labels from the y-axis and still identify the two regions easily. I could add 1 billion to all the values, or multiply them all by 1 billion and it wouldn't change the nature of the problem at all.
In that case there is no problem. You just plot and the eye balls will tell you.
The digital version of eyeballs (or, at least the retinal neurons at the back), would be a neural network.
For sure, a suitable neural network would give excellent results - almost certainly better than me and my eyeballs.
I feel like training a deep neural network would be overkill, but it's looking more and more likely that I will have to resort to some kind of machine learning to find a solution.

You'll need to determine whether amplitude or variance metrics are suitable for detecting the "quiet region" in your application, and how long the detection window needs to be. There is a normal tradeoff between Pd (probability of Detection) and Pfa (probability of False Alarm) that goes along with varying the window length. You just need to figure out what works best for your particular application. Often you can plot the Pd and Pfa curves and pick a spot either where they cross or where you optimize some performance metric that is important to you.
So much is application dependent that there will be no single or canned answer.
@Slatribartfast It's definitely true that I have no hope of finding an algorithm that will always find the correct answer.
However, given that I can eyeball the correct answer in the vast majority of cases, I'm reasonably confident that - for example - a deep neural network could get good results (most likely outperforming me).
And if a neural network can do it (without any external parameters being provided), then perhaps something simpler could too.
This is basically edge detection. For every sample index n, look at
(variance from n-L to n) / (variance from n to n+L)
Assuming your samples are independent and normally distributed (within the high and low variance regions), you can use the F-distribution to see how unlikely your ratio is for the given L. You will need to choose a maximum L based on any prior knowledge.
Choose a confidence level for the F-test to find candidate start times. Invert the above ratio and repeat the process for end times. Hopefully your start and end candidates mark your low-variance regions.
@heycosmo How important is the assumption that the samples are normally distributed? (I don't think my samples will be anything close to normally distributed in general).
I don't think it will be that important if the difference in variance is as consistently dramatic as shown in your example. If you want to detect differences in variance where sigma_1/sigma_2 ~ 1, then it probably matters very much.
Your distributions are probably somewhat bell-shaped, so you could make use of the central limit theorem to get closer to a Gaussian, but that requires a larger L (i.e. rather than compute the variance of the samples, compute the variance of the average of groups of samples).
Ultimately, you're looking at a variance ratio as a function of L. For small L, a large ratio is less likely to imply an edge. As L increases, a large ratio increases your confidence that an edge was found. You might find that a ratio > 10 for L=5 is a good edge indicator. If you have the data, play around; that's what your neural network would do ;).
You might want to look at using a moving mad (median absolute deviation) filter... https://www.mathworks.com/help/stats/mad.html
The first question is whether you want to detect this region in real-time or non real-time. If it is in real-time you may face some delays in detection of the region but the width of region would be the same.
1- You can use a running variance (running power) method. This basically uses a running window (you can adjust its width) on the signal. When the power (variance) of the signal within the window drops below a certain threshold that means the start point and when it passes the threshold again that means end of the region. Simulink (Matlab) has a running variance block and you can easily test your signal and choose the best window and threshold. You may use the same method in non real-time mode and increase your accuracy by multiple passes back and forth and changing the window length.
2- Another option could be zero crossing detection but you need to remove the mean fisrt and it may not very accurate.
3- Teager energy operator could be another solution. It is very easy and is defined as: E(n) = x(n)^2 - x(n-1)*x(n+1); It is used for transient detection and it is again using a threshold. This method has a very low delay.
@SaeidSeyd You can assume I have infinite (parallel) processing capability, if required.
1. How should I calculate the size of the block and the threshold from the data? I don't think answering this question is necessarily easier than answering my original question.
2. The means of the two regions are not known. To estimate them, we would need to know where the regions are (which means solving the main problem).
3. This only takes into account 3 samples at a time. I don't think there is any algorithm that could solve my problem well while only sliding a 3-sample window over the data.
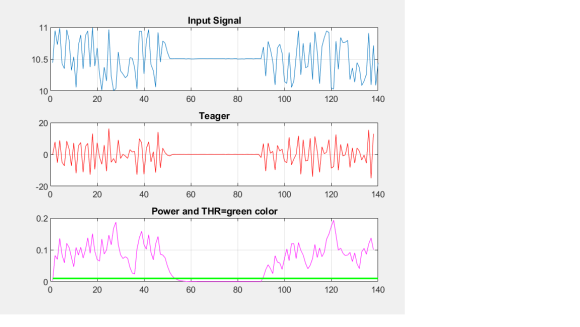
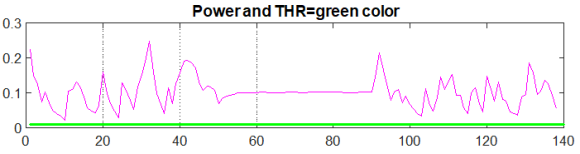
Here is a sample matlab file for "Power" and "Teager" and their figures. For both you can set a threshold. I have plotted the threshold for the power in the figure. Alpha and the threshold are your design parameters depending on your signal characteristics. You can also normalize your signal or remove the mean before any processing but these are real-time methods. Larger alpha lets you set the threshold higher and avoid false alarms but the detection point will be more delayed. If you want to measure the width of the low variance region that delay probably would not matter.
Both methods are real-time. If you apply the same power analysis for x(-n) and then average the threshold crossings you get better estimate of the low variance point. These are simple methods anyway, you can of course think of more complex methods with better accuracy.
You can also use zero-delay (non-causal) FIR filter for power calculation and then thresholding similar to the IIR method here.
===================
clear
close all
% Generate a sample signal
x1=[1*rand(1,50) 0.01*rand(1,40)+0.5 1*rand(1,50)]+10;
% Teager Energy Operator
for k1=2:1:length(x1)-2
E(k1)=x1(k1)^2 - x1(k1-1)*x1(k1+1);
end
% Running power (IIR filter).
z=x1-mean(x1);
alpha=0.6; % you may try other values for alpha
p(1)=z(1)^2;
for k1=2:1:length(x1)-2
p(k1)=alpha*p(k1-1) + (1-alpha)*(z(k1)^2);
end
figure
subplot(3,1,1)
plot(x1)
title('Input Signal')
grid
subplot(3,1,2)Power_Teager.png
plot(E,'r')
grid
title('Teager')
subplot(3,1,3)
plot(p,'m')
grid
title('Power and THR=green color')
hold on
Thr=0.01*ones(1,length(x1))
plot(Thr,'g','linewidth',1.5)
If x1 is defined like this:
x1=[1*rand(1,50) 0.01*rand(1,40)+0.9 1*rand(1,50)]+10;
Then what threshold value should I use?
@ You can use a simple DC blocker first (e.g. 1/(1-beta*z^(-1))) and then apply the power method.
Teager energy still works for this scenario.
You may also think of Teager first and then power. There are many possibilities one can consider and choose the best option depending on the application at hand.

This is a common problem in Electronic Warfare (finding times when the Jammer is "off" so that you can transmit). Because of that, you'll find different approaches by looking through the literature of EW focused publications. What is your specific application?
@ChuckMcM The mean could be higher in the "low variance" region than in the "high variance" region. Therefore, the power could be higher or lower in the "low variance" region.
Therefore, I think my question is deceptively different from power detection. It seems like we should "just subtract the mean". But the means of the two regions are unknown, and in order to estimate them, we need to know where the regions are, which means solving the main problem.
determine the envelop of the signal. then pass it through thresholding. from the rectangular pulse one can estimate the period or duty cycle.
hope it helps.


