


What reason to prevent me from the achieving accuracy better than microsecond of delay?
I have 2 PERFECT data of the transmitter and receiver. From 2 data, I can calculate the delay estimation:
Fs = 8e6; % sample rate
...
    for i = 1:2
        [cc_correlation,lag]    = xcorr(signal2(i), signal1);
        [cc_maximum, cc_time]   = max(abs(cc_correlation));
        cc_estimation           = abs(length(signal1) - cc_time);
        delay(i)                = cc_estimation/Fs;
    end
Then I have the matrix of delays are 11 microseconds and 13.875 microseconds.
The expectation in nanosecond from this function because from the sampling rate, I can see the period time T=1/Fs=125ns. Therefore, the delay should be in nanosecond, not microsecond as I had.
When I call the matlab function above:
[cc_maximum, cc_time] = max(abs(cc_correlation));
It returns the values which are called cc_maximum, and another value cc_time. It is sample data.
What did I do wrong for this algorithm?
My professor also said:"you don’t have function, you have sample version of the function, the xcorr is a waveform of continuous function, they have a maximum in the current of time. When you work with a sample, the waveform you have entire function tell the value of the function you have discrete time"
and I still do not understand what his mean?
I hope someone can help me out.
Thank you.

You have it all wrong!!
I assume you have signal1(tx) and signal2(Rx) both at same sampling rate and same centre frequency. Then you only need to correlate the pair once, find maximum and convert to delay in samples then into nanoseconds.
You don't have to correlate twice and once you get maximum of correlation you need to convert to delay remembering that correlation output is twice length of signal.
to convert max to delay in samples:
L = length(x1); //same as x2
y = xcorr(x1,x2);
n = find(y == max(y)) ;
n = mod(n,L)+1;
delay = L - n;
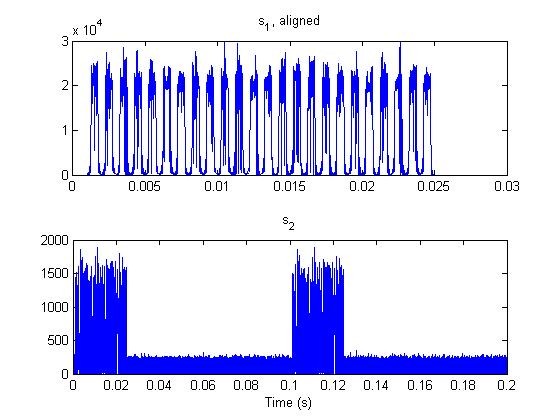
here is my TX and RX data, and trying to show you the reason why I cut RX data into 2.
and If I correlate the pair once, I can have this:
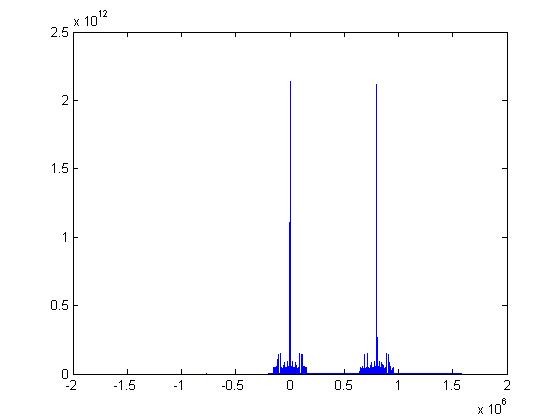
that make me confuse, if i choose 2 peaks of the xcorr, so I can have 2 delay, is it right? or i have only 1 delay (higher peak) so I have only 1 delay? which one is right?
I don't see how you can correlate these two signals. As far as see they are so different. Apart from noise, they could be on different sampling rate or different centre frequency or are different in phase.
and also you can see in detail this topic, i posted couple days ago but no one replied or commended.
https://www.dsprelated.com/thread/2915/how-to-calc...
I know i did wrong, but you know what I am trying to do. This forum is good, but very seldom people reply, Thank you for reply.
well according to your diagram they correlate. You should use one burst of tx and capture Rx with some sort of synchronised trigger. then Rx vector would be different length. Try this then(you may need to modify it):
L = max([length(tx),length(rx)]);
y = xcorr(tx,rx);
n = find(y == max(y)) ;
n = mod(n,L)+1;
delay = L - n;
after trying your code:
delay = 87;
delay = delay/Fs; % 1.087500000000000e-05 (still in microsecond)
check the code works by directly counting samples and you might try inserting zeros at end of short vector. Then getting microseconds is not surprising especially if your capture trigger is wrong.
By the way I assume this hardware not simulation.
so, If this code is still getting in microsecond, So I have to check to hardware?
we can see the sample rate is 8MHz, the the wavelength = speed of light / sample rate = 3*e8/8e6 = 37.5m
But when I collect data, signal sends from TX to the RX wirelessly (therefore we have noise included), the distance between TX and RX is about 3 to 5 meters, Do you think, it will effect to the result?
you are not just measuring air delay but DAC/ADC/antennas/Rf/ and any digital processing involved and you also need to have some trigger so that you measure the relevant burst.
good advises, Thank you very much, KAZ.
it seems your time scale is not helpful as such. So you have two bursts.
you only need to correlate once with some sort of sync as to which rx relates to tx.e.g.if you can send one tx wave and stop.
I just discussed with the professor, he also mentioned the expectation for the delay will be 3ns or better (less than 1m).
I do not have continue function, I jsut have function of the sample time (sample waveform different to the continuous of time waveform)
I am taking sample number of delay, that way never going to be more accurate then half of 125ns (about 20m)
I combined data taken in different time and I am treating the result I taken the same.
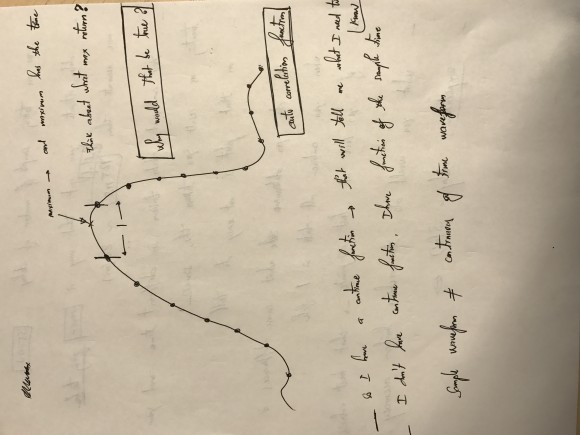
He also mentioned about the solution on the curve of auto-correlation which is attached below.
Do you have any ideal?
Sounds a familiar professor mystery problem/solution.
What I can tell is that xcorr of a pair of tx data/rx data helps find out time delay from start of tx data to start of rx data. This is not just air delay.
Your discussion mixes between delay and continuous math function.
Apparently the professor is asking to find the interpolated maximum of xcorr rather than max sample location. So yes the difference from computed sample peak to actual peak is less than 1 sample. By actual peak I mean the peak of curve at top, so it requires interpolation between two samples. one way is to use matlab interp of xcorr result using very high interpolation rate then find new max.
But at the end I don't see any meaning for such exercise or its relation to delay apart from saying it can increase the accuracy (resolution) of derived delay to nanoseconds.
An interpolation rate of 125 will take you to 1 ns accuracy
@kaz: very helpful, I also look at the maxlag parameter of the xcorr function, do you think it can be used?
And, that would be nice if you can show me in the matlab code for the interp of xcorr
thank you very much.
And if the length(x1) is not same length(x2) can I add zeros on x1 make to the same length with x2?
and and also you can see in detail this topic, i posted couple days ago but no one replied or commended.
https://www.dsprelated.com/thread/2915/how-to-calc...
I know i did wrong, but you know what I am trying to do. This forum is good, but very seldom people reply, Thank you for reply.
Here is my example using interp then xcorr:
tx = randn(1,1000);
rx = [0 0 0 tx(1:end-3)];
tx = interp(tx,125);
rx = interp(rx,125);
y = xcorr(tx,rx);
L = length(tx);
m = find(y == max(y));
n = L-m;
delay = n*1000/(8*125) % @Fs*125 MHz
doing this way:
https://www.dropbox.com/s/le4ppw32l4sp5ll/RX1.dat?...
https://www.dropbox.com/s/zr04pff9skeh8cn/TX.dat?d...
format long;
%% initial values:
nsamps = inf;
nstart = 0;
Fs = 8e6; % sample rate 8MHz
F_0 = 520e6; % center freq 520MHz
c = 3e8; % speed of light
%% input data
file_tx = 'TX.dat';
file_rx = 'RX1.dat';
x_tx = readcplx(file_tx, nsamps,nstart);
x_rx = readcplx(file_rx, nsamps,nstart);
tx = interp(x_tx,125);
rx = interp(x_rx,125);
% figure, plot(x1,abs(x_tx),'o', xq1, abs(x_tx1), ':.')
% xlim([1 1.6e4]);
% legend('original','interpolation')
s1 = tx;
s2 = rx;
y = xcorr(tx,rx);
L = length(tx);
m = find(y == max(y));
n = L - m;
delay = n*1000/(8*125), % delay = -173989037
this is very huge number of the delay, do you know why?
It is not just large delay but also negative i.e. the receiver gets it before it is sent by tx. This possible if time is reversed & Only God knows!
Work out my example, I put 3 zeros delay. try more zeros and see.
It looks like you need to go mod(m,L) but that means your Rx is broke relative to tx. so your signal capture is wrong relative to tx or xcorr gives wrong peak. You can check that visually on the plot. see if there is good peak and see if rx is ahead of tx.
an interpolation rate of 125 will take you to 1 ns accuracy and I suggest you do that on signal1 and signal2 instead of doing it on xcorr result and find delay from that as before.
@kaz:
So, I have to interpolate rate of 125 first on signal1 and signal2, then I have 2 new signals let say s1 and s2.
I can cross-correlation s1 and s2 to get the delay, that delay will give me in nanosecond.
I do not see any different, before adding interp1, I have timeDiff = 1.1e-05, but after adding interp1 (tried with rate 2,4,6,..,50) the timeDiff is getting increasing (away from the nano second, such as: 1e-5, 1e-4, 1e-3...)
Did I do right? please fix me!
I did xcorr on your data and found out delay = 176 samples on 8MHz.
Then I tried interpolate by 25 (as 125 is too much) and got 4400 samples.
I used first 100000 sample of TX & RX1 data.


