


Hi,
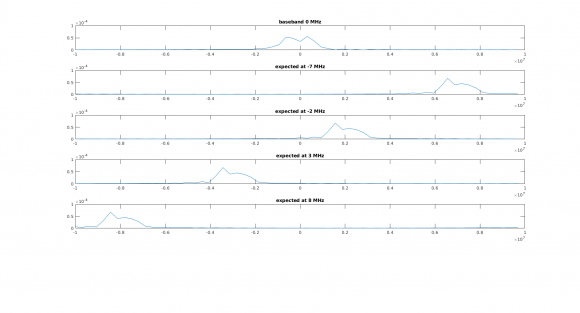
It might be a very silly question. I have a baseband zigbee dump (zigbee._baseband.mat attached). I wish to shift it to -7 MHz, -2 MHz to the left and also 3 MHz, 8 MHz to the right. But when I multiply with corresponding carries and plot the fft, I see just opposite. What I am missing here?
Here is the script
~~~~~~~~~~~~~~~~~~~~~~~~~~~~~~~~~~~~~~~~~~~~~~~~~~~~~~~~~~~~
close all
load('zigbee_baseband.mat') % Baseband
fc2430 = -7e6;
fc2435 = -2e6;
fc2440 = 3e6;
fc2445 = 8e6;
fs = 20e6;
t = (0:1/fs:((1/fs)*(length(interference)))-1/fs);
carrier2430 = exp(1i*2*pi*fc2430*t)'; % shift to -7 MHz
carrier2435 = exp(1i*2*pi*fc2435*t)'; % shift to -2 MHz
carrier2440 = exp(1i*2*pi*fc2440*t)'; % shift to 3 MHz
carrier2445 = exp(1i*2*pi*fc2445*t)'; % shift to 8 MHz
interference2430 = interference.*carrier2430;
interference2435 = interference.*carrier2435;
interference2440 = interference.*carrier2440;
interference2445 = interference.*carrier2445;
subplot(6,1,1)
plot([-64/2:64/2-1]*(fs)/64,(fftshift(abs(fft(interference,64)))))
subplot(6,1,2)
plot([-64/2:64/2-1]*(fs)/64,(fftshift(abs(fft(interference2430,64)))))
subplot(6,1,3)
plot([-64/2:64/2-1]*(fs)/64,(fftshift(abs(fft(interference2435,64)))))
subplot(6,1,4)
plot([-64/2:64/2-1]*(fs)/64,(fftshift(abs(fft(interference2440,64)))))
subplot(6,1,5)
plot([-64/2:64/2-1]*(fs)/64,(fftshift(abs(fft(interference2445,64)))))zigbee_baseband.mat
Do you mean shift by -7 Mhz or shift to -7 Mhz? Becuase the plot isn't clear enough.

As the baseband is it 0 MHz, either is applicable i.e. shifting to -7 MHz or shifting by -7 MHz.
I have attached the picture now for downloading. untitled.png
Link also https://ibb.co/exxvLc
What it seems to be happening is that the spectrum is reversed, probably due to aliasing.
What is "interference"? Could you plot without multiplying by it?
Interference is zigbee. Yes when I plot it without multiplying with carrier, it lands on 0 MHz. The very first plot in the subplot.

Why is there minus at -1/fs
t = (0:1/fs:((1/fs)*(zb_packet_len))-1/fs)So that the length of time array is equal to the length of interference. Apology these was a confusion in naming.
load('zigbee_baseband.mat') % Baseband loads 'interference' variable to workspace. This is actually zigbee baseband oversampled at 20 MHz.
I just corrected in the post also.
I notice the signal shape at baseband is slightly different when frequency shifted. This may give a clue
Yes indeed. I found the mistake. I was supposed to transpose the carrier array by using ' operator but since carrier is complex, so ' operator was doing a conjugate transpose.

I hate it when I do that. Having the ' operator do a conjugate transpose is exactly correct, but forgetting that is a pain. .' to the rescue.


