


Online interpolation of temporal signal
I have a signal generated from an accelerometer, what I want to do is to receive the incoming signal and check if it is in a certain interval, if it is then I can apply interpolation on it(but interpolation is not the main issue). The basic problem is how to divide a signal into chunks Online and by online I mean that I don't already have an upper time limit of the signal.
A graph to describe further:
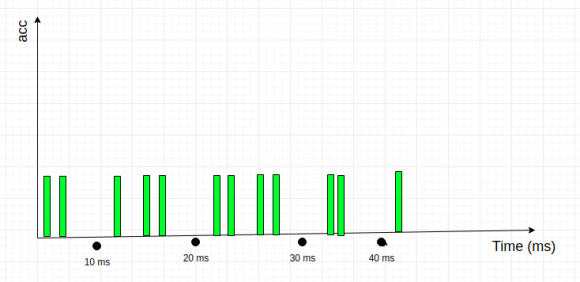
Green Signals are the actual samples I am receiving. Let suppose I have received first 2 Green Bars then I'll wait for 3rd green point and use interpolation to find a point at 10ms after that the 4th point will arrive and I want to use it to improve my interpolation by including 3rd and also 4th point until I reach 20ms where I will use the same method used on 10 ms point.
Until now what I have done is divided whole time sequence into chunks and performed interpolation but that is not very practical as in practice I won't have complete sequence already. I'm using python but it is not important. Any suggestion in this regard is highly appreciated.
If this question is in the wrong place please let me know which platform should I use.

If you expect that the accelerometer readings should be linear with time, at least over the time interval being considered, then use linear regression: Use the data points you have so far, going as far back in time for as long as you think the signal should be linear with time, and calculate the best straight line through the points that you have. Then simply calculate the y coordinate of the line at the x coordinate (really the 't', or time coordinate) that you want to fill in.
On the other hand, if you expect that the signal is really sinusoidal, AND if you have at least 3 consecutive samples, then consider the fact that all sinusoids comply with the following difference equation:
y(n) = 2*cos(2*PI*f/fsample)*y(n-1) - y(n-2).
Use this equation to solve for 'f', and then fill in y(n+1), y(n+2), ...
You can re-run the above equation as you get another set of 3 consecutive samples.
Not to nit-pick, but the term "interpolation" means filling in points *between* points that you have. The term "extrapolation" means filling in points *outside* the bounds of the points that you have.

I think this is the correct place and you will find lots of people that can help. The problem is that your question isn't expressed very well... it isn't clear what you are doing or the issue you need to solve. I'd invite you to rewrite it in more detail.

I see green bars arriving at irregular time intervals and of large positive magnitude, from which you are "interpolating" black dots at (presumably) regular time intervals with small negative magnitude.
Does that sum it up? Because it if does, all I can say is HUH?!?!?!?!?!
What are you doing? And I don't mean getting irregular samples from an accelerometer -- I mean what human-oriented task are you trying to accomplish (drive a car, monitor an earthquake, etc.)? Why are your samples irregular? Are you really interpolating big positive things into little negative things?


