


A question on Rick Lyons' Understanding Digital Signal Processing 5.3.1 about Gibbs’s phenomenon
Hi,
If anyone has a copy of this book could you please shed some light here: I was trying to reproduce the example shown in section 5.3.1 Window Design Method's Figure 5-19 which illustrates the ripples in the frequency domain in octave. Just as the book suggested, when you have any dropped tap in time domain, you will see Gibbs phenomenon in the frequency domain. However, my question is that, why don't you use all 32 tap in this case (the book is dropping 1 tap from 32 tap to get 5-19(c) )? When I use all 32 taps, I can see the un-distorted frequency domain here since the iDFT and DFT pretty much cancelled out each other here...I think I am missing some points here the book is trying to make...
Thanks,
Will

Hi Will. You asked an important question.
As I stated in the text, we want 31 h(k) coefficients and we want them to be symmetrical in the time-domain. That is, we want the first coeff to be equal the last coeff, the second coeff to be equal the next to the last coeff, and so on. We want that symmetry in order to produce a filter that has exactly linear phase (exactly flat group delay in the filter's passband).
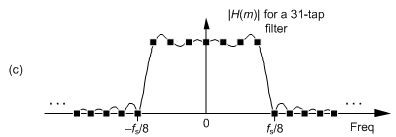
My Figure 5-19(c) is "not the greatest." That figure is better illustrated below where we see the center samples of the DFT magnitudes of our filter's coefficients are shown by the dots. However, the complete (infinitely-fine resolution) frequency magnitude response curve shows the ripples that are always present when we try to achieve sharp transitions (sharp filter "roll-off") in the frequency domain with a finite number of samples (coefficients) in the time domain.
Try this: Zero pad Figure 5-18(a)'s 32 asymmetrical coefficients out to a length of 256 samples. Perform a 256-point FFT on the sequence, perform an 'shiftfft()' comand to put the passband on the middle of the freq-domain plot, and plot the unwrapped spectral phase. Your plotted spectral phase will look quite linear. However, compute and plot the group delay (the negative of the derivative of the phase) of the unwrapped spectral phase sequence. The passband's group delay will look pretty darn flat. But if you zoom in on the passband group delay plot you'll see that the passband's group delay is NOT exactly flat. The group delay fluctuates in value over the passband. That tells us the filter is NOT an exact linear phase filter.
Next, try the above 'phase/group delay' analysis on the 31 symmetrical coefficients in Figure 5-18(b). In this case you should see our desired super-flat group delay telling us the 31-tap filter has super-linear phase.
I hope what I've written makes sense.
Thanks Rick. Your updated drawing really resolved my confusion. I was puzzled before how we can see the rippled frequency response by doing the FFT/iFFT exercise and the fact is that we can not since all the analyze frequency from FFT/iFFT are orthogonal to one another so we will always see these particular dots forming a flat line in frequency domain (if full taps are used). We can only see the rippled waveform when we use the time domain sample to do DTFT analysis. Also thanks for adding the detail information on why we are dropping the extra tap here..I misunderstood that this is done in order to create the rippled waveform before.


