


Additive Synthesis Analysis
In order to reproduce a given signal, we must first analyze it
to determine the amplitude and frequency trajectories for each
sinusoidal component. We do not need phase information (![]() in (10.18)) during steady-state segments, since phase is normally
not perceived in steady state tones [293,211].
However, we do need phase information for analysis frames containing an
attack transient, or any other abrupt change in the signal.
The phase of the sinusoidal peaks controls the position of time-domain
features of the waveform within the analysis frame.
in (10.18)) during steady-state segments, since phase is normally
not perceived in steady state tones [293,211].
However, we do need phase information for analysis frames containing an
attack transient, or any other abrupt change in the signal.
The phase of the sinusoidal peaks controls the position of time-domain
features of the waveform within the analysis frame.
Following Spectral Peaks
In the analysis phase, sinusoidal peaks are measured over time in a sequence of FFTs, and these peaks are grouped into ``tracks'' across time. A detailed discussion of various options for this can be found in [246,174,271,84,248,223,10,146], and a particular case is detailed in Appendix H.
The end result of the analysis pass is a collection of amplitude and
frequency envelopes for each spectral peak versus time. If the time
advance from one FFT to the next is fixed (5ms is a typical choice for
speech analysis), then we obtain uniformly sampled amplitude and
frequency trajectories as the result of the analysis. The sampling
rate of these amplitude and frequency envelopes is equal to
the frame rate of the analysis. (If the time advance between
FFTs is
![]() ms, then the frame rate is defined as
ms, then the frame rate is defined as
![]() Hz.) For resynthesis using inverse FFTs, these data may be
used unmodified. For resynthesis using a bank of sinusoidal
oscillators, on the other hand, we must somehow
interpolate the envelopes to create envelopes at the signal
sampling rate (typically
Hz.) For resynthesis using inverse FFTs, these data may be
used unmodified. For resynthesis using a bank of sinusoidal
oscillators, on the other hand, we must somehow
interpolate the envelopes to create envelopes at the signal
sampling rate (typically ![]() kHz or higher).
kHz or higher).
It is typical in computer music to linearly interpolate the
amplitude and frequency trajectories from one frame to the next
[271].11.10 Let's call the piecewise-linear upsampled envelopes
![]() and
and
![]() , defined now for all
, defined now for all ![]() at the normal signal
sampling rate. For steady-state tonal sounds, the phase may be
discarded at this stage and redefined as the integral of the
instantaneous frequency when needed:
at the normal signal
sampling rate. For steady-state tonal sounds, the phase may be
discarded at this stage and redefined as the integral of the
instantaneous frequency when needed:
When phase must be matched in a given frame, such as when it is known to contain a transient event, the frequency can instead move quadratically across the frame to provide cubic phase interpolation [174], or a second linear breakpoint can be introduced somewhere in the frame for the frequency trajectory (in which case the area under the triangle formed by the second breakpoint equals the added phase at the end of the segment).
Sinusoidal Peak Finding
For each sinusoidal component of a signal, we need to determine its
frequency, amplitude, and phase (when needed). As a starting point,
consider the windowed complex sinusoid with complex amplitude
![]() and frequency
and frequency ![]() :
:
| (11.20) |
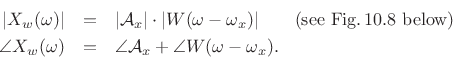
As discussed in Chapter 5, the transform (DTFT) of this windowed signal is the convolution of a frequency domain delta function at
![\begin{eqnarray*}
X_w(\omega) &=& \sum_{n=-\infty}^{\infty}[w(n)x(n)]e^{ -j\omega nT}
\qquad\hbox{(DTFT($x_w$))} \\
&=& \sum_{n=-(M-1)/2}^{(M-1)/2} \left[w(n){\cal A}_xe^{j\omega_xnT}\right]e^{ -j\omega nT}\\
&=& {\cal A}_x\sum_n w(n) e^{-j(\omega-\omega_x)nT} \\
&=& \zbox {{\cal A}_xW(\omega-\omega_x)}
\end{eqnarray*}](http://www.dsprelated.com/josimages_new/sasp2/img1822.png)
Hence,
At ![]() , we have
, we have
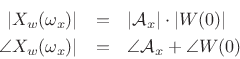
If we scale the window to have a dc gain of 1, then the peak magnitude
equals the amplitude of the sinusoid, i.e.,
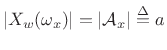 , as shown in Fig.10.8.
![\includegraphics[width=0.8\twidth]{eps/peak}](http://www.dsprelated.com/josimages_new/sasp2/img1826.png)
If we use a zero-phase (even) window, the phase at the peak equals the
phase of the sinusoid, i.e.,
![]() .
.
Tracking Sinusoidal Peaks in a Sequence of FFTs
The preceding discussion focused on estimating sinusoidal peaks in a single frame of data. For estimating sinusoidal parameter trajectories through time, it is necessary to associate peaks from one frame to the next. For example, Fig.10.9 illustrates a set of frequency trajectories, including one with a missing segment due to its peak not being detected in the third frame.
![\includegraphics[width=0.8\twidth]{eps/tracks}](http://www.dsprelated.com/josimages_new/sasp2/img1828.png)
Figure 10.10 depicts a basic analysis system for tracking spectral peaks in the STFT [271]. The system tracks peak amplitude, center-frequency, and sometimes phase. Quadratic interpolation is used to accurately find spectral magnitude peaks (§5.7). For further analysis details, see Appendix H. Synthesis is performed using a bank of amplitude- and phase-modulated oscillators, as shown in Fig.10.7. Alternatively, the sinusoids are synthesized using an inverse FFT [239,94,139].
![\begin{psfrags}
% latex2html id marker 27619\psfrag{s} []{\Large$s(t)$}\psfrag{tan} []{\Large$\tan^{-1}$}\begin{figure}[htbp]
\includegraphics[width=\twidth]{eps/analysis}
\caption{Block diagram
of a sinusoidal-modeling \emph{analysis} system
(from \cite{SerraT}).}
\end{figure}
\end{psfrags}](http://www.dsprelated.com/josimages_new/sasp2/img1829.png)
Next Section:
Sines + Noise Modeling
Previous Section:
Additive Synthesis (Early Sinusoidal Modeling)


