


Python scipy.signal IIR Filtering: An Example
Introduction
In the last posts I reviewed how to use the Python scipy.signal package to design digital infinite impulse response (IIR) filters, specifically, using the iirdesign function (IIR design I and IIR design II ). In this post I am going to conclude the IIR filter design review with an example.
Previous posts:
The @tymkrs crew had a series of posts on using a pulse width modulated (PWM) signal as a cheap and quick digital to analog converter (DAC). In the DAC setup the PWM signal is filtered with an analog filter, typically a passive 1st order RC filter with a -20dB/dec response. This will convert the "digital" PWM signal to an analog signal.
@tymkrs posts on PWM:
I am going to use the PWM signal as an example with the IIR digital filters. Although this is not the typical application for a digital filter it will be instructive to explore the frequency content of the PWM signal and experiment with discrete filters created with the scipy.signal functions.
Pulse Width Modulated Signal
Pulse width modulated signals are generated by varying the duty cycle of a periodic digital signal. One way to view this, is to start with a clock signal, the clock signal will have a period T and a 50% duty cycle. Now to generate a PWM signal, the period will remain fixed and the duty cycle will vary, as illustrated in figure 1. The duty cycle is the difference between the low and high portion of the signal in a period, as shown in figure 1.
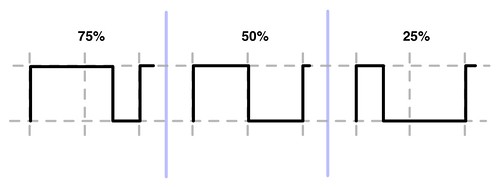
Figure 1: PWM Examples
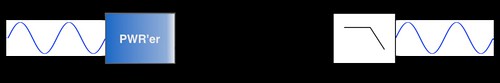
Figure 2: Modulation - Demodulation
The @tymkrs posts have examples of demodulating the PWM signal with an RC filter. In general, you will take a PCM digital signal, modulate to a PWM signal, then demodulate with a filter. The subsequent are examples of PWM signals and the corresponding spectrum.
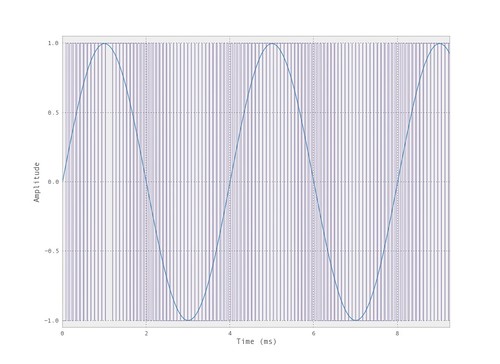
Figure 3: 1kHz Signal and the PWModulated Signal
The following figure shows the spectral content of a PWM signal. But at this view it is difficult to notice the peak of the 1kHz input tone.
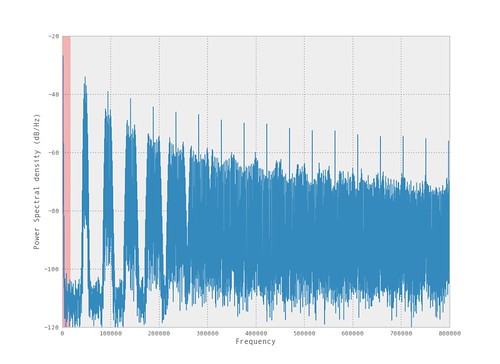
Figure 4: Spectral Content 1kHz PWM Signal
In the zoomed in version it can be observed the 1kHz tone is present.

Figure 5: Zoomed Spectral Content 1kHz PWM Signal
There are all kinds of useful links on the web showing how the Fourier series can be used to describe a square wave with a set of sine waves:
The Fourier series theory states that any periodic signal can be represented by a sum of sines, as our spectral plots above suggest. We can filter the PWM signal to remove the higher frequency harmonics and be left with the original signal.
In the above figures we see the full spectrum of the PWM signal analyzed. When the entire signal is analyzed the spectrum from time begin to time end of the signal is calculated. But we don't get information about what frequencies occur when.
We can use the spectrogram to create a 2-D image which gives a visualization of the frequency content in time. The following is a spectrogram of the PWM signal.
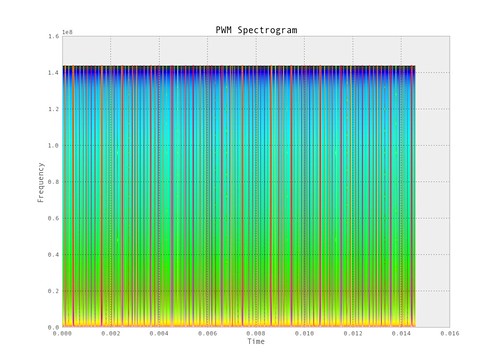
Figure 6: PWM Spectrogram
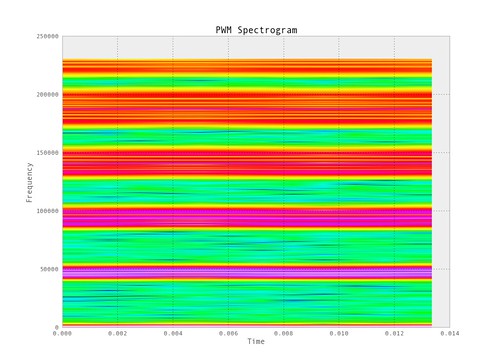
Figure 7: Zoomed PWM Spectrogram
Specifing a Filter (demodulating)
If we want to specify a filter, starting with an anit-alias filter specification from the perspective of the input signal, is as reasonable a spot as any. That is, given the "sample rate" of the PWM generator (the rate it grabs the input digital signal) set the cutoff at half the rate, in this case 32kHz/2. Looking at the above spectrum this is a reasonable choice.
Using the scipy.signal package a first order butterworth filter can be designed with:
It should be noted this type of filter is straight-forward to compute by hand as well.
$$ |H(\omega)|^2 = \frac{1}{1 + \varepsilon _p (\frac{\omega}{\omega _p})^{2N}} $$The following is the frequency response and the z-plane of the filter designed.
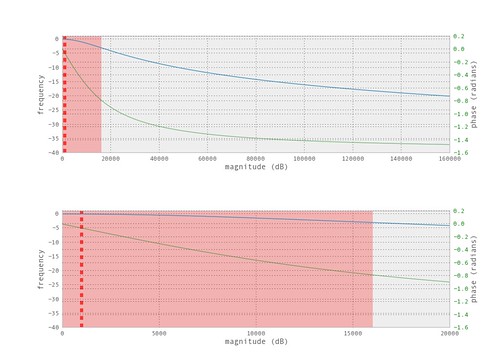
Figure 8: Simple Filter Response
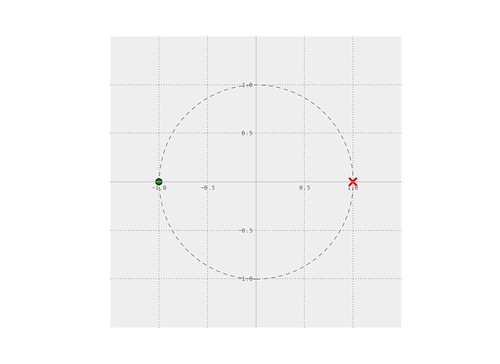
Figure 9: Simple Filter z-plane
To filter the signal, with the filter coefficients we just created, there are a couple different functions to use from the scipy.signal package:
- lfilter : Filter data along one-dimension, given b and a coefficients
- filtfilt : A foward-backward filter, given b and a coefficients
- convolve : Convolve two N-dimensional arrays
There is a write up on the different performance metrics for the above methods. I am using the filtfilt function for two reasons: one it removes the delay of the filter (only the delay of the PWM coversion will be present), second filtfilt handles some of the numerical complexities for larger order IIR filters.
The following is the spectrum and time signal of the filtered signal.
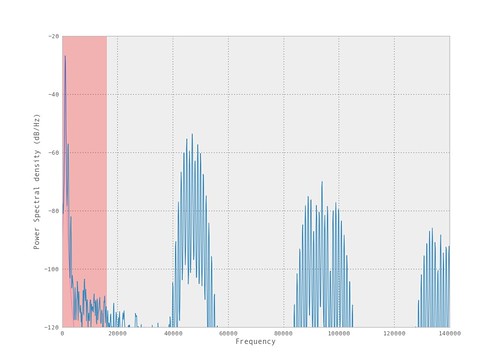
Figure 10: Filtered Spectrum
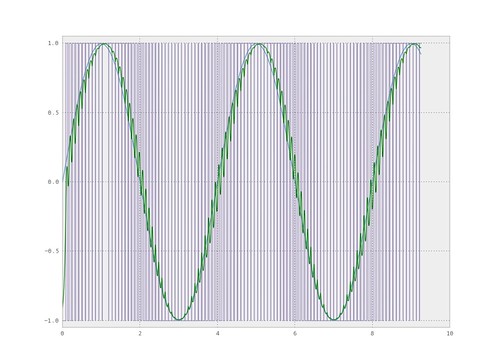
Figure 11: Filtered Signal (Demodulated)
From the spectrum and time series plots we can see that the higher frequency components of the PWM signal are not fully removed. Most would regard this as considerable noise to the original signal. Even so, this can be a simple direct method to add a low SNR DAC to a microcontroller and/or FPGA.
To have less noise a more agressive filter is required. We can use the filter design tools to build a higher performance filter.
The frequency response and z-plane for the filter.
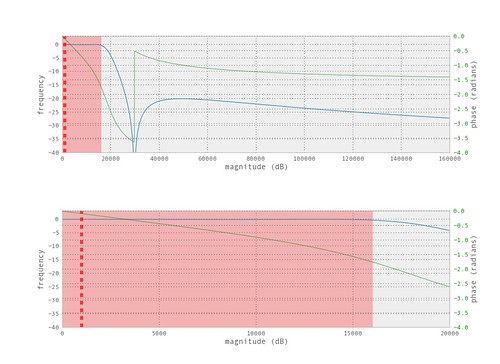
Figure 12: Simple Filter Response
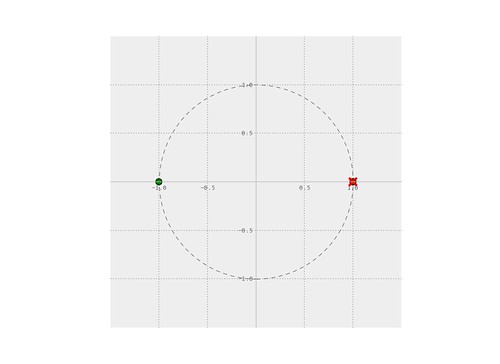
Figure 13: Simple Filter z-plane
The filtered spectrum and time-series plots:
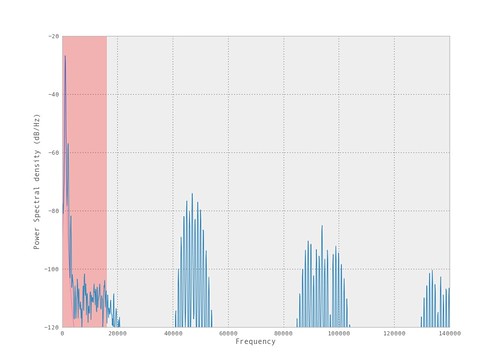
Figure 14: Filtered Spectrum
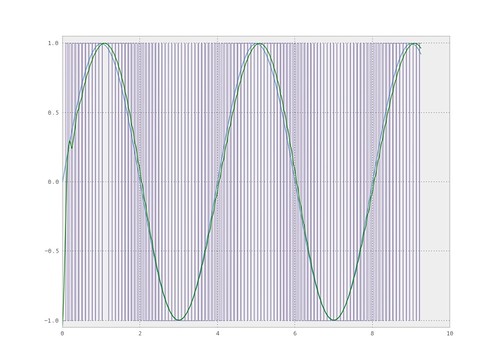
Figure 15: Filtered Time-Series Result
The spectrum view gives a good look at the signal. We can still see considerable frequency components above the cutoff frequency but the higher frequencies have been attenuated considerably, enough that we can't see it in the time plots (it doesn't really mean anything that we cannot visually see the noise/distortion). A sensitive ear would be able to detect the difference between the original signal and the demodulate signal. To achieve more attenuation we could try and use the design funcitons inputing larger attenuation. But the design functions will not do well (may fail to design a filter). Let's look at some other options and see why a single IIR filter design given the above parameters can be problematic.
I haven't talked about Finite Impulse Response (FIR) filters and the scipy.signal design functions, yet. The following is using a zery high order FIR filter to squash majority of the high unwanted frequencies added by the PWM signal.
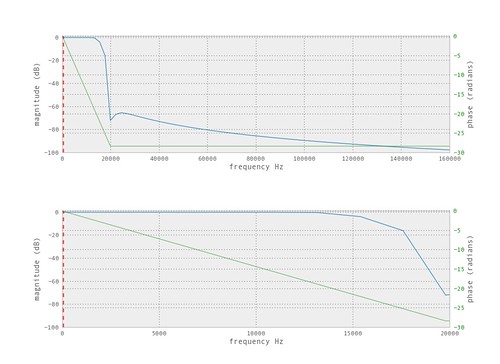
Figure 16: FIR Filter Response
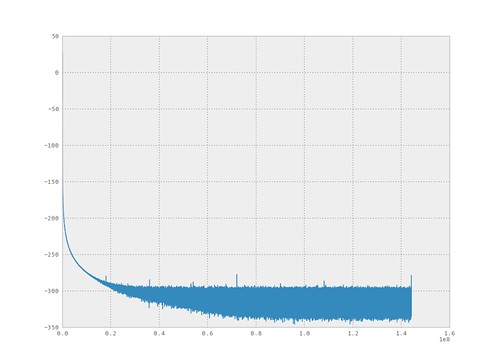
Figure 17: PWM Signal Filtered, FIR
This is a little ridiculous. Typically we would not want to use such a high order filter but the FIR design functions allow a design with our aggressive specification. The reason this filtering task requires such a higher order filter is because the bandwidth (passband) of the filter is much smaller than the bandwidth of the signal. In this case, I was using a high simulated sample rate, Fs = 288MHz, and we are trying to filter down to a sample rate of 32KHz. It is more common to have stages of filters and reduce the sample rate as you filter.
Look for future posts to review the scipy.signal functions used to design and analyze FIR filters.
As mentioned, instead of trying to filter this example with one narrow filter it is better to break it up into filtering stages and reduce the sample rate after each stage. There are efficient techniques to perform this multi-rate filtering typically with FIR filters. Here I will use the straightforward example of a bunch of IIR filters.
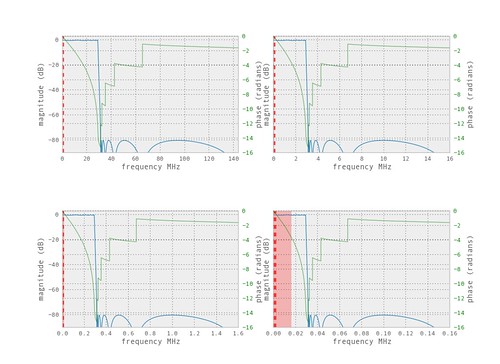
Figure 18: Staged Filters
From the above response plots it can be seen that a greater attenuation can be achieved with the wider passband (smaller passband-to-bandwidth ratio). Again, I am using the PWM as an example of using an IIR digital filter to a signal and not necessarily an efficient or pratical method to perform the task.
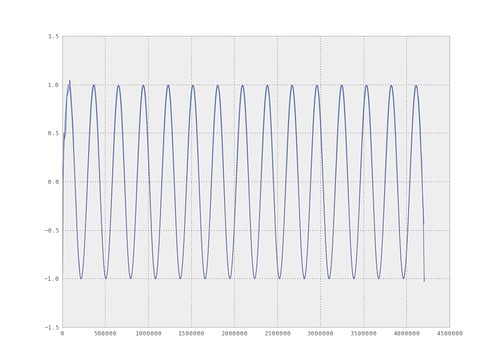
Figure 19: Demodulated Signal by Staged IIR Filtering
This filtering was achieved with much smaller filters, as seen above the butterworth filter the higher frequency components had medicore attenuation. The higher order filter produced a nice looking waveform but analyzing the spectrum the higher frequency components were still present. Now with the staged IIR filtering there is less higher frequency components and the individual filters are less complex. As mentioned, this is because our desired filter bandwidth (band of freqeuency desired to pass) is much smaller than the sample rate.
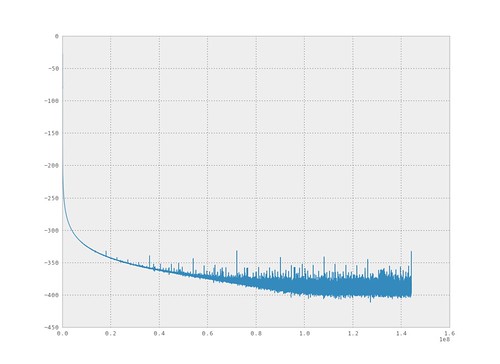
Figure 20: Demodulated Spectrum by Staged IIR Filtering
RC Filter
As we mentioned, the PWM is commonly used to create a simple DAC from a digital system. Commonly, implementers will use a simple RC lowpass filter to demodulate.
$$ H(\omega) = \frac{1}{1 + RCj\omega} $$
We want our cutoff (in this case the 3dB) at 16kHz. We can choose values of :
R = 50 Ohm
C = .2 uF
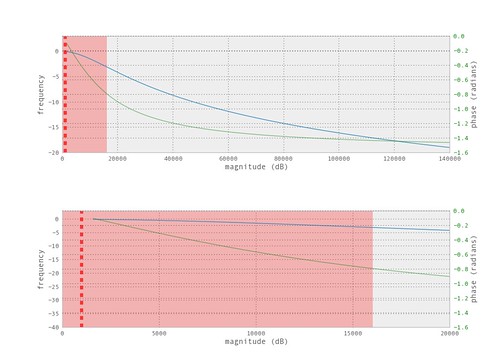
Figure 21: RC Filter Response
This response is the same as the response for our above butterworth filter. We would expect to have the same results for our RC demodulated system.
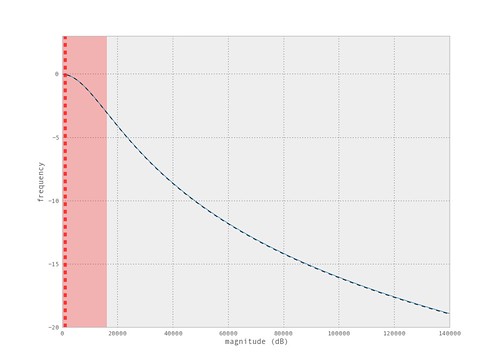
Figure 22: Butter and RC Filters
PWM HDL Model
To generate the PWM signal I created an RTL behavioral model in MyHDL. This was a simple way to create the PWM signal and it can be synthesized to logic and be used in an FPGA.
The complete PWM module can be found here.
- Comments
- Write a Comment Select to add a comment
To post reply to a comment, click on the 'reply' button attached to each comment. To post a new comment (not a reply to a comment) check out the 'Write a Comment' tab at the top of the comments.
Please login (on the right) if you already have an account on this platform.
Otherwise, please use this form to register (free) an join one of the largest online community for Electrical/Embedded/DSP/FPGA/ML engineers:


