


Moving Average Filter's Magnitude Response
I am working on filtering of data using the Moving average filter in MATLAB.
My data is recorded temperature values on the Y-axis and Time(in seconds) on the X-axis
(I'm getting the magnitude response curve as attached)
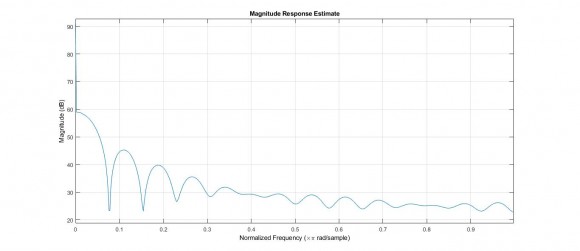
The shape of the curve seems fair for the moving average filter, and it's theory suggests the same.
I want to ask, why am I getting all the magnitude value for MA filter positive? (is that correct?)
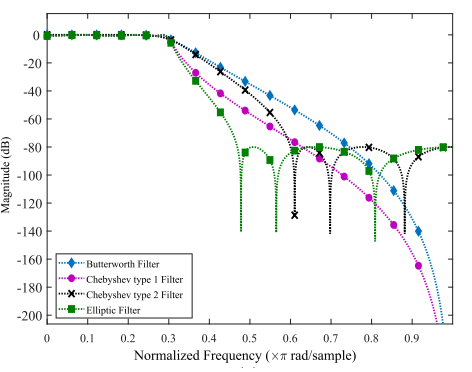
Implementing other filters like Butterworth etc. on the same data gives the magnitude value to be negative.
Here is my MATLAB Code for MA (if it helps)
%T.Temp is table column containing Temperature values in double format.
MovAvg = dsp.MovingAverage(5)
movAvgOut = MovAvg(T.Temp)
fvtool(movAvgOut)
%Gives output the first image I attached
Any help is appreciated.
Thank you.

You do not say how you are actually calculating the moving average filter's magnitude response. I suspect numerically, and without a lot of insight. The MA filter's response at an integer multiple of 1/width is exactly zero. Not kind of zero -- exactly so.
You are probably calculating using a set of frequencies that never land exactly on a harmonic of the MA filter. Try that -- what you should see is that it'll break your ability to plot easily on a log-log graph, because $$ \lim_{x \to 0} \log x = -\infty $$
So, 'fvtool' is a filter visualization tool and it plots all of these characteristics of the filter itself, like-phase response, magnitude response, group delay etc.
I really don't know what it does in the background, but seems to work pretty good.
Thanks :)
The 'fvtool' needs filter coefficients or second order sections (sos) matrix. See MATLAB's documentation for 'fvtool'. You are passing filtered data and not filter coefficients, which is not the desired input to fvtool function.
Nonetheless, having a positive magnitude simply means the filter is adding gain to your signal (increasing amplitude). That's what I can make sense of the positive magnitude response.
Regards,
Sagar
This solved it!
Do you also know why there are so many different function say for implementing the MA filter in MATLAB e.g - movmean(), dsp.movingAverage(), (1/windowSize)*ones(1,windowSize),using filterDesigner tool to make a lowpass,rectangular window filter.
Are all of these doing the same thing i.e. implementing the MA filter? Then why so many function for this?
Thank you so much!
-Varun

dB scales are relative to something, so the positive numbers just mean that whatever the reference is, those values are above it. The filter response plot you included is done using a typical methodology where the pass band magnitude is the reference (0 dB), so the transition and stop bands are shown as how much attenuation is achieved compared to the passband.
So you just need to figure out what reference was used in your plot so that you can understand it or adjust it.
Yes, I tried doing that but meanwhile came across the official implementation of fvtool and realized that I should input the filter instance rather than the filtered data, and then the plot turned out to be exactly as I wanted.
Thanks :)
Hello varungupta: Please post a plot of your temperature data, as well as the filtered output. Since Amplitude and Magnitude are often confusingly used, please define/ explain Magnitude as you mean it.
cheers
Thank you, but turns out I was passing filtered data instead of the filter's instance in fvtool, which solved my issue.

Hi,
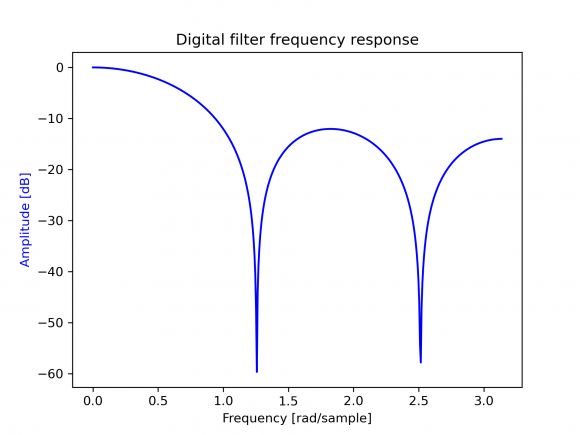
This is simple filter with window length of 5 (coefs 0.2). I got this using Python;
import numpy as np
from scipy import signal
import matplotlib.pyplot as plt
b = np.ones(5)/5
w, h = signal.freqz(b)
fig, ax1 = plt.subplots()
ax1.set_title('Digital filter frequency response')
ax1.plot(w, 20 * np.log10(abs(h)), 'b')
ax1.set_ylabel('Amplitude [dB]', color='b')
ax1.set_xlabel('Frequency [rad/sample]')
Also you seem to get frequency response for output signal (fvtool(movAvgOut)), not filter response (MovAvg)
Thank you so much :)
Only if I had found this sooner.
Do you also know why there are so many different function say for implementing the MA filter in MATLAB e.g - movmean(), dsp.movingAverage(), (1/windowSize)*ones(1,windowSize),using filterDesigner tool to make a lowpass,rectangular window filter.
Are all of these doing the same thing i.e. implementing the MA filter? Then why so many function for this?
Thanks man.
I'm glad that it helped.. Different libraries in a computing environment may provide same functionality sometimes, and you may also derive simple coefficients yourself sometimes (like in this case (1/windowSize)*ones(1,windowSize)).

you have scaled dc to 60 db. lower it to zero by scaling coeffs by sum of coeffs
yes, that was an option as well, to scale it.
But, I was using the fvtool somewhat incorrectly by passing filter data instead of the filter (instance) itself.
Thanks :)


