


How to evaluate a Multiple Moving Sources Localization technique by the graphical results?
 Started by 3 years ago●5 replies●latest reply 3 years ago●127 views
Fellow colleagues,
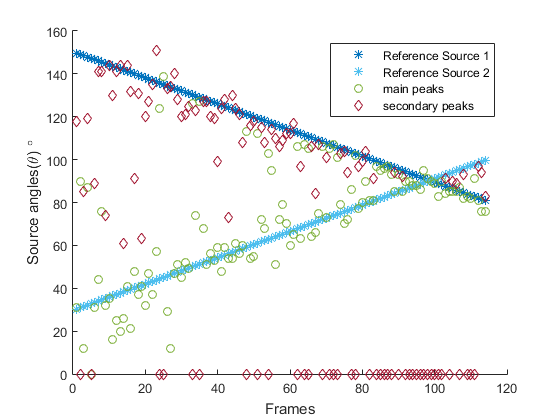
I'm currently working on Multiple Moving Sound Sources Localization. However, I'm also having some issues choosing the best "metric" in order to evaluate my results. In the picture annexed, for instance, I simulated two sound sources moving in a circular trajectory, with the same radius from the referenced sensor, crossing each other at some point. As you can see, since the two sources have different attenuations for their signals through time, my localization algorithm always gives me two well-defined peaks, one stronger than the other (main and secondary), in the results, following somehow the expected trajectory for each source. My question is: How to evaluate numerically those results? Since the main and secondary peaks are supposed to be unknown, and change from one source to another after the crossing, I can't just choose one vector of main peaks and calculate its error related to the vector of expected peaks related to one source. I'm open to ideas.
It seems the problem of localizing moving sources with a given receptor set you have already solved. To evaluate the accuracy of the localization you can use the mean (and standard deviation) of the Euclidean distances between the reference source positions and the estimated positions. Depending on the application not only the mean distance error but its standard deviation may be constrained.
Yes, the problem of localization is solved.
Thank you for the tips. So, as far as I can see, the information about the difference between main and secondary peaks is useless then. I have to treat them equally. Since each frame (vertical line on the graph) has two peaks (the main and the secondary), I just need to choose, for each of the two reference points, the closest peak and then evaluate as you describe it, right?
Well, if you have two sources and two references, you have two errors at each time frame. Probably, it is easy to find the closest peak to each reference, and then you can calculate the two peak-reference distances. Averaging those two distances over all time frames of your experiment will give a measure of the error in the localization of the two sources. In fact, if you have S sources and T time frames you must average S*T distance errors. Calculating the standard deviation of such S*T distance errors you get a measure of the variability of the error.

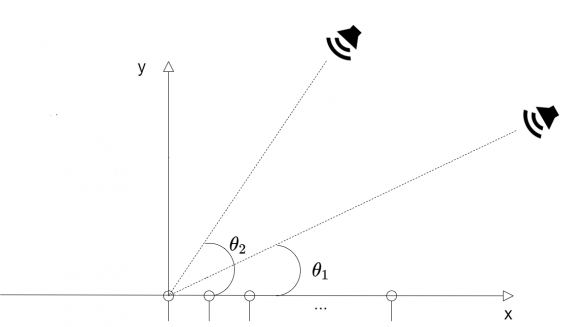
How many receivers do you have? I would think tracking multiple sources would require multiple receivers so you at least have some time delay to work with. Can you draw a picture of what your system looks like - I probably don't understand the problem.
For the given example, I'm using 10 sensors in Linear Configuration. One of them is the reference for the TDOA calculations. The image below describes the situation if you imagine the sources are moving.
I don't know if I made myself very clear. I'm sorry about that. My question is what is the best way to evaluate the results I'm getting, since just looking at the graphs is not enough for a formal presentation.


