


changing FFT resolution of known sweep signal leads to unexplained spectrum
 Started by 3 years ago●10 replies●latest reply 3 years ago●320 views
Hi All,
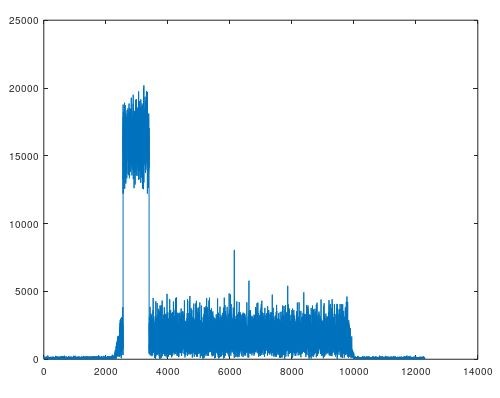
Below is fft of a sweep signal "x" which is 1.08MHz wide at edge of otherwise empty LTE 10MHz bandwidth.
The sweep range is -4.5MHz ~ -3.42, with 839 tones at resolution of 1.25KHz each (plus guardband of 13 zeros on left, 12 zeros on right), time domain must be 12288 samples.
plot(abs(fftshift(fft(x(1:12288))))); This is correct case and gives 1.25KHz resolution
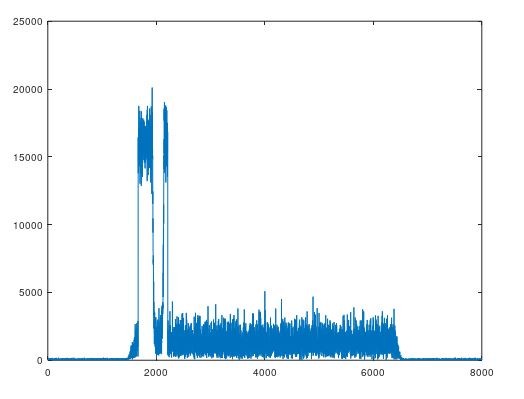
During testing I noticed that if I use fewer time domain samples I get unexplained differences of frequency domain: below is an example using 8000 samples instead of 12288. This means fft resolution is now more than tone resolution by 12288/8000 * 1.25KHz = 1.92KHz
I can't explain why there is the below anomaly near centre of band.
It happened that our capture was initially 8000 samples and this shape led us to think that signal is wrong but I believe it was just misleading because as we went to 12288 samples all looked ok.
plot(abs(fftshift(fft(x(1:8000)))));
Any thoughts on my conclusion.
here is the octave file data (I Q) if it helps.
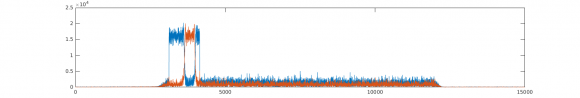
It looks like only this part of the spectrum is preserved in the first part of the signal:
plot(abs(fftshift(fft(x(1:8000), 15000))));
hold on
plot(abs(fftshift(fft(x(8000:end), 15000))));
I wouldn't change the fft resolution but keep it same as vector length. Ideally vector is 12288 samples, so that should be fft resolution because the tone spacing is 1.25KHz (LTE Prach). for 10MHz case the resolution needs 15.36MHz/12288 = 1.25Khz.
using smaller chunk of same vector at its size fft resolution or 12288 resolution doesn't show bandwidth any better.
I believe those center tones lose power due to some "scalloping"-like issue.
The question: is this due to time domain limitation since each tone needs indeed 12288 samples for 12288 FFT or is it that a small FFT swallows it up.

My impression is that 'gap' in the frequency band is, as you expect, caused by the undersampling of the signal. You will have a period where you have an almost fs/2 (i.e. 2 sample per cycle) matching of the sampling to the signal, such that your sampling is nearly at the cos(0deg) and cos(180deg) points of the chirp signal. During that period of time, you get no reported signal. Add variations on that theme.
In a real system the sampling aperture will mask that a little compared to the exact sampling of the digital simulation.
Investigate further. It's far more informative than all the exact simulations!
At the places you plot the abs(), also plot the phase of the frequency spectrum, etc.
Thanks, will try see phase.
I never thought of undersampling because the signal is actually upsampled by 6 from its generation point at 2.56Msps into 15.36Msps and added to LTE.
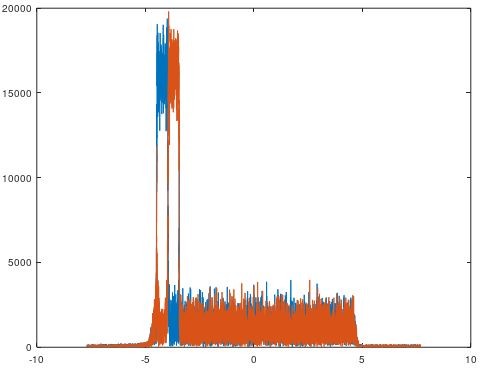
Here is the phase and amplitude of bad case(blue is ampl, brown is phase):
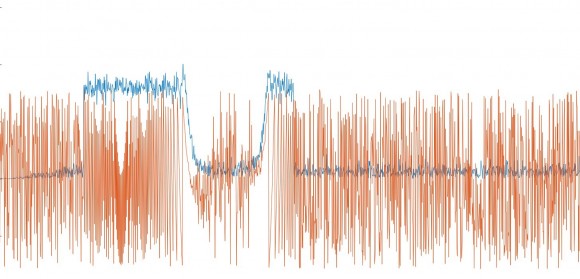
As @krasin notes the missing signal frequencies appear in the second half of the signal. That will be because it's a chirp, so the frequency changes with time (= position in the x signal)..
You will see in your brown/blue plots the nice phase ramp corresponding to the frequency drop out, which makes for an interesting investigation about phase effects. It's also worth thinking about the frequency signals as being 'cycles per sample width[length]', allowing for matlab/octave's "off-by-one" problem.
Also think about how long an individual frequency lasts for (in samples) during a chirp. In the FFT there exists only a set of fixed frequencies, despite the impression given by the simulation that the signal is continuously changing (see the old sin(x)/x stuff, and where the nulls place themselves!). For the chirp the signal strength is very low because it exists for such a sort time, but reported amplitude is averaged over the whole sample time!
I think that explains it. So the tones are not generated from start to end but are time dependent. That makes good sense. My assumption was that each tone is generated per whole vector but it now seems they are changing with time. Thanks.
Further work reveals that if I select first half of vector using full FFT resolution then second half using again full FFT resolution I get only the relevant half of spectrum (plus a spike):
f=(-.5:1/12288:0.5-1/12288)*15.36;
plot(f,abs(fftshift(fft(test(1:12288/2),12288)))); hold; %first half
plot(f,abs(fftshift(fft(test(1+12288/2:end),12288)))); %second half
I never expected that since half time domain contains all tones from start to end and is more than enough for any tone to be picked up by FFT. If I keep increasing any half of vector, FFT shows more and more of other half until full band as if Time domain corresponds directly with frequency domain.
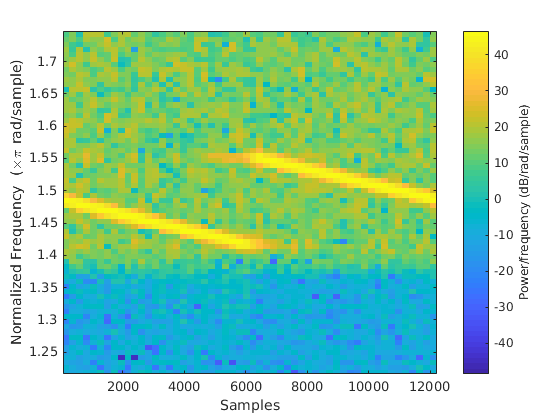
May be the imput signal is the key - here is a spectrogram of the signal
load test_data_3569.txt
x = complex(test_data_3569(:,1), test_data_3569(:,2));
spectrogram(x,256,30,256, 'yaxis')
Sorry for not using 12288 point FFT, 15000 was faster to type :)
Thanks Krasin. That is the proper way to analyse input. I did not consider that a pretty chirp signal will cheat me that much


