


Consider the following characteristic of a nonlinear amplifier for two different frequencies:
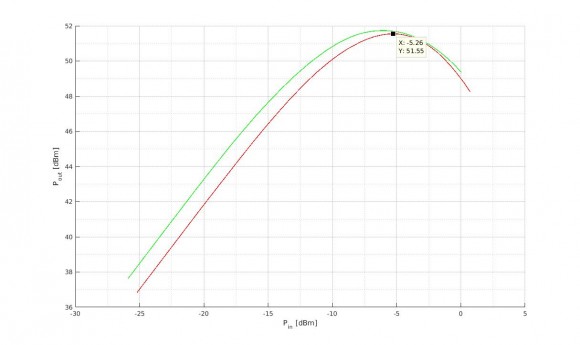
I want to design a filter which shifts the green characteristic horizontally to that degree, by which the saturation point of the red and the green characteristic differ. In this case that's about 0.68 dBm.
I want to design such a filter using MATLAB. My first idea was to simply add the difference (0.68 dBm) to my input signal. And I still think this would work. But I did not design a filter then, did I? I mean, don't I have to come up with a transfer function of my filter? Also, filtering should create some sort of memory, i.e. I should consider the signal before the actual time step: x(t-1) . Anyways, I am confused, maybe you hvae some ideas?

Hello,
I think you need to provide additional information before we can get a handle on your question.
First of all your figure has no legend. What are the frequencies that correspond to the green and red curves?
Secondly, did you create the figure? It looks like it was created in Matlab because of the data-tip graphic shown on the red curve. If you did create the figure, that would suggest you have access to the function for the non-linear amplifier. If this is the case, can you tell us what the amplifier transfer function is?
Lastly, I am not sure what you mean by "saturation point." Are you referring to the maximum vertical point for the two graphs? If you are, then the saturation point for the two curves, as you've shown it, is different. Do you just want to filter one of the frequencies such that the difference is about 0.68 dBm?
Michael.

Do you want the thing to have the same power gain at both frequencies? If so then you need something frequency-sensitive, which means you need a filter.
As Michael said, you need more frequency points, unless all that you care about is the behavior at just those two frequencies.
Alltogether, I am given the AM/AM characteristics at 5 different frequencies. So I think I can set up a modell describing the nonlinearity in the range of these frequencies. I included a link in the anser to dudelsound, which underlies my problem, I think.
understand your graph correctly, it is an amplitude plot - input amplitude vs. output amplitude. So you are probably talking about pre-distortion. That means you apply different gains for different amplitudes to linearize an otherwise non-linear element like an amplifier.
The problem with non-linear systems is that there is no this-is-the-way-to-do-it-in-10-steps solution since the solution depends on the kind of non-linearity you want to compensate.
If you just want to lower the green curve by 0.68dBm, you only have to multiply it by 10^(-0.68/20) = 0.9247
I don't think I understand the modell correctly. It says, the input has to be preemphasized in order to get the correct output. But why do I get the correct output then?
When I am given a signal
x(t) = P1 * sin(2*pi*f1*t) + P2 * sin(2*pi*f2*t),
why can't I just say P1 changes according to the characteristic belonging to P1 and P2 changes according to its characteristic?
Is it, because superposition doesn't hold?
You can! But only if you are synthesizing the TX signal - in other words if you create those signals in matlab like you did above, you can of course change the synthesis gains P1 and P2. But if you are given the signal x(t) with no control over P1 and P2 and you still want to change amplitudes of the signle sinusoids, you'd have to use a filter - a pre-emphasis filter. And that would have delay-memories and everything. Semi-technically speaking: The filter needs to "watch" the signal for some time to be able to tell the frequencies apart.
ok. I am given 5 different AM/AM characteristics (as a table, from which I can of course plot the figures). And I want to use Matlab in order to tell what results I can expect, using the PSB modell. If I understood correctly, I would do the following:
input x(t) =
P1*sin(2*pi*f1*t) + P2*sin(2*pi*f2*t)
Now, if f2 is the center frequency, I shift f1 horizontally such that the peaks of the two curves are aligned.
Then I change P1 and P2 according to the AM/AM characteristic which belongs to the center frequency.
output y(t) =
P1_out*sin(2*pi*f1*t) + P2_out*sin(2*pi*f2*t)
And then in the end, I shift P1 vertically?
This seems so weird to me. My intuition would be to change P1 according to its characteristic and P2 according to the other. No horizontal and/or vertical displacement.
This is pure simulation, btw.
I don't quite understand what you are trying to do and what that result of yours is supposed to show... If you want to show the deviation of the shifted AM/AM curves to your center AM/AM curve, you can just use the tables themselves. You can do the left/right shift by interpreting the table values for input x as though they were values for [x minus shift]... And then you can add the output gain delta-G to those results and plot(or otherwise evaluate) the difference to your center curve...
yeah, sorry to be so unclear about my question, I had some troubles understanding the problem. I think I got it now:
I want to characterize a nonlinear amplifier. For this purpose I am given 5 single-tone measurements - the AM/AM and AM/PM characteristics. Now, I consider the center frequency characteristic. Every other characteristic - including those at frequencies not measured! - can be obtained from the center frequency characteristic by shifting it horizontally and vertically. The first thing to do, is to figure out by which amount I have to shift the characteristics for both frequencies greater and frequencies smaller than the center frequency. I can get this information from the measurements and assume it applies for other frequencies as well. Then I have to design two filters: one filter has to perform the horizontal shifting. The output of this signal will be the input to the center frequency characteristic. And the signal will then be filtered again by a filter which performs vertical shifting.
My question: A filter is characterized by a transfer function. How can I obtain this transfer function?
In your case it seems to me that absolute phase is not that important, so I'd say you have a few given fix-points of your filter transfer function given by gain and frequency - something like (-3dB) for (f0-2MHz). Now you have to find a transfer function - created of an arbitrary number of poles and zeros - that match your given gains at the respective frequencies. I usually do stuff like this by hand so I'm not very experienced what kind of fitting function of Matlab or Scilab you could use for that - there probably are fitting solutions out there - you might want to google that.
If your implementation is digital you can also create (draw) your required frequency response and then transform that back into the time domain giving you the impulse repsonse (all-zeros transfer function) of your filter...
ok. So, I hope I understand correctly:
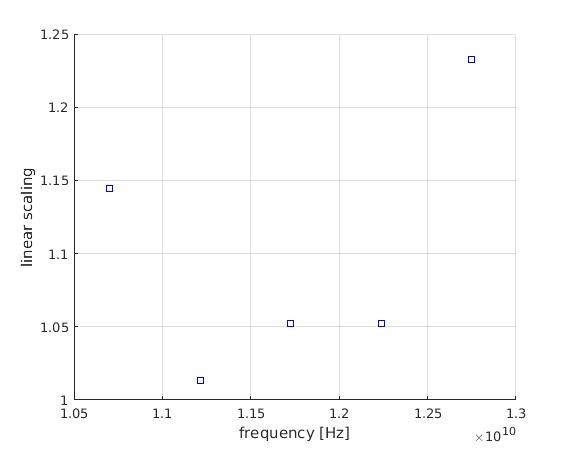
I want my filter to shift my nonlinear characteristics towards the center characteristic. E.g. the characteristic at f1 = 10.7 GHz has to be shifted by -0.76 dBm. A filter is defined by its transfer function. My input signal will be multiplied by the transfer function and at the output, the P_in of my signal will be shifted the way I want it to.
P_in1_saturated * shift1 = P_in1_saturated + horizontal_shift1
solve for shift1 yields shift1 = 1.1445
This should be the value that I have to multiply P_in1 by in order to achieve the horizontal shift of -0.76 dBm.
Doing this for the 5 different characteristics given, yields:
- sorry, I find it so hard to understand
yourself by mixing up a few things that are all correct in some sense, but in different senses :)
Firstly: Your filter does not "shift my nonlinear characteristic". The filter has nothing to do with your nonlinear characteristic - in the contrary: Your filter is linear. It is designed so that it amplifies certain frequencies and attenuates another frequency. The EFFECT is such, that the combination of your filter and the nonlinear characteristic at some frequency f is a shifted version of the original nonlinear characteristic.
Secondly: You have a mix of the operations 'shift', 'multiply' and 'add'... In your formula:
P_in1_saturated * shift1 = P_in1_saturated + horizontal_shift1
you add one shift and multiply another shift. Here's the thing: shifting and adding and multiplying describe the SAME operation in different viewing angles!
SHIFTING is the effect you want to achieve. Left/Right-shifting is achieved by ADDING some (pos/neg) gain to the input of your nonlinear system, up/down-shifting is achieved by ADDING some (pos/neg) gain at the output.
However, the gain you ADD is in dB - on a logarithmic scale. ADDING two log values is equivalent to MULTIPLYING two linear values.
So what you want to do is this:
Consider your system has only two frequencies: 10Hz and 20Hz. You have a non-linear amplifier cahracterized by
y = (x * (1 + 0.1*f) )^2 * (1 + 0.1*f)
so, for 10Hz you have y(t) = (1.1*x)^2 * 1.1 and for 20Hz you have y = (1.2*x)^2 * 1.2.
That's bad - you accept the non-linearity, but you would like it to be the SAME for all frequencies, so you apply a filter to the input and output of the system. Your input filter needs to make sure that the input x is "shifted" or attenuated such that for 20Hz within the parenthises "()^2" there is the same content as for 10Hz.
So your input filter has two fix points:
Gain = 1(0dB) for f = 10Hz and
Gain = 1.1/1.2 for f = 20Hz
applying this filter to x (x' = filter * x) you will have
y = (1.1 * x') * (1 + 0.1*f) - you have removed one frequency dependency.
Now you have to deal with the output. You need a filter with two fix points:
Gain = 1 for 10Hz and
Gain = 1.1/1.2 for 20Hz
applying this filter to y you will get (y' = filter2 * y)
y' = (1.1 * x') * 1.1
YOu have made it! You now have the same non-linearity for all your frequencies of interest. It's still non-linear, but not frequency dependant anymore...
thank you so much, dudelsound! I finally got it.
... now I will have to find a way of implementing it in matlab.


