


Error in acquired data from RC low pass filter channel.
Hey all,
I am generating the burst of sine wave of 5 volt and sending it over analog output channel of my Ni USB 6356 board. This signal is transmitted to the input port of the RC low pass filter (R=15Kohm, C= 1nF ie Fcutoff= 10.6Khz). The output of this RC circuit is acquired on the analog input of same USB 6356 board.
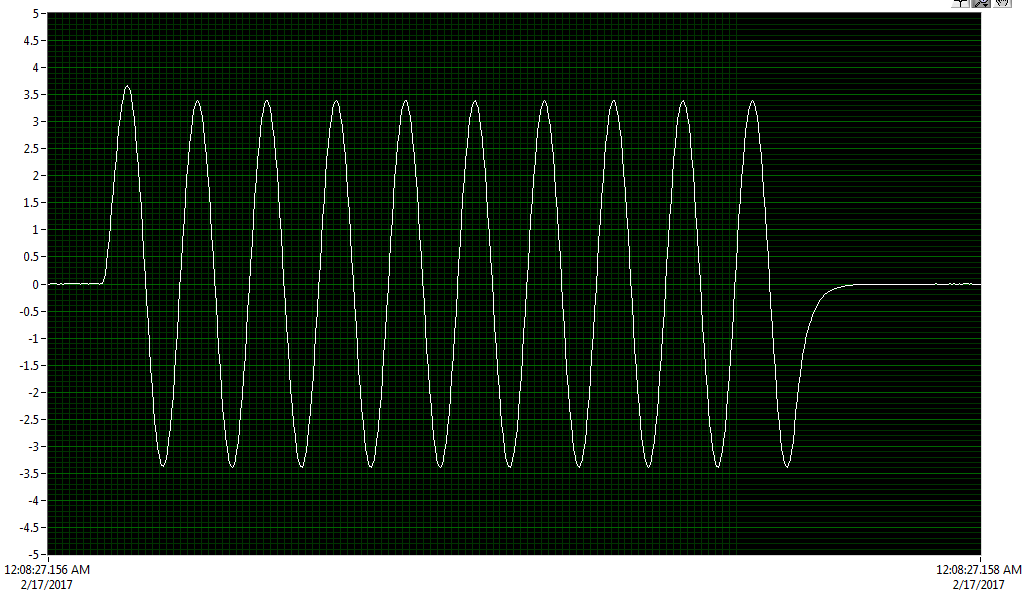
According to the theory, the amplitude of sine signal at cutoff frequency should be 3db less than the input signal (5x0.707 = 3.53V). I am getting a pretty close result but with a weird problem. In my received signal, the first cycle of sine wave is of 3.53V but rest of the cycles are of 2.9V. In fact, for all the different sine frequencies, the amplitude of first cycle is more than the rest of the cycle. The image attached will give you the exact understanding of the problem.
I want to plot bode plot (frequency and phase response wrt frequency) by sending sweep signal through my output channel. But because of this problem, my bode plot is little bit shifted downwards from the theoretical response.
How can I prevent the amplitude of first cycle from reducing?
Please help in identifying and solving this problem.

What do you mean by "generating the burst of sine wave"? If you are using a sinusoidal input that is "turned on" at time zero, the filter's response will consist of an initial transient response that is followed by a steady-state response.
I am not sure why the amplitude of the first cycle of the filtered signal is larger than your input signal. Are you discharging the capacitor prior to testing with each input frequency?
Applying a sinusoidal input signal in a switched-on manner to a RC lowpass filter will result in an initial transient response and a steady-state response. The "severity" of the transient response is governed by the relative duration the filter's time constant to the period of the sinusoidal signal applied to the filter.
Here are two cases illustrated with the following Matlab code:
close all; clear all; clc;
set(0, 'DefaultFigureWindowStyle', 'docked');

sample_rate = 20e3;

d_butter = fdesign.lowpass( 'N,Fc', 8, 1e3, sample_rate );
    hd = design( d_butter, 'butter' );

fvtool(hd);

sample_period = 1/sample_rate;

net_time = 1;
    time_indices = sample_period:sample_period:net_time;


% 50 Hz Sinusoidal Input Signal
sinusoid = sin( 2 * pi * time_indices * 50 );
    filtered_sinusoid = filter( hd, sinusoid );

figure; hold on; plot(sinusoid); plot(filtered_sinusoid, 'r'); legend('Unfiltered', 'Filtered');
xlim([0 1e3]); ylim([-1.25 1.25]); grid on; shg;


% 800 Hz Sinusoidal Input Signal
sinusoid = sin( 2 * pi * time_indices * 800 );
    filtered_sinusoid = filter( hd, sinusoid );

figure; hold on; plot(sinusoid); plot(filtered_sinusoid, 'r'); legend('Unfiltered', 'Filtered');
xlim([0 100]); ylim([-1.25 1.25]); grid on; shg;
The filtered 50 Hz sinusoid is shown here,
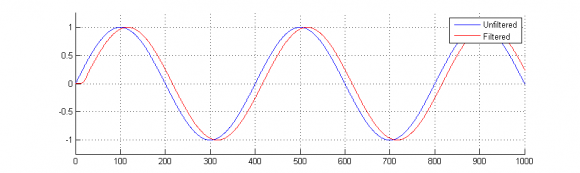
The filtered 800 Hz sinusoid is shown here,
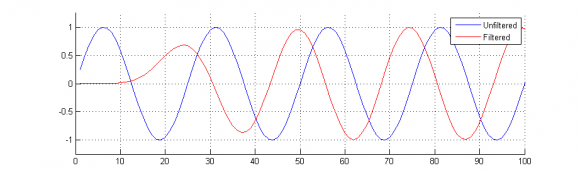
The horizontal axis in both plots has been adjusted to show the first few cycles of the input and filtered signals.
The designed lowpass filter has a cut-off frequency of 1 kHz, which has a corresponding time constant of approximately 159 micro-seconds. The period of the 50 Hz sinusoid is much larger relative to the time constant of the lowpass filter as well as the period of the 800 Hz sinusoid. As a result, the transient response associated with the lower sinusoidal input frequencies will be less noticeable.
The steady-state portion of the filter's response should be used for the determination of the Bode plot response.

As others have already pointed out, a dynamic signal may well not exactly match your expectations when using steady-state analysis. You can't have both. But, you may be able to get close by ignoring the initial transient.
This also applies to using a sweep. It's a dynamic signal, i.e. not a long-term stable single-frequency sinusoid. So depending on the rate of the sweep, the signal will depart from steady-state single-frequency results. The faster the sweep, the worse the result.
It's pretty easy to analyze as has already been shown.
I want to plot the phase vs frequency plot using this sweep signal. I am using correlation to find the phase difference between the received signal (from the RC circuit) and original signal. I am getting accurate results for lower frequencies but bad results for higher frequencies. I am sweeping from 1Khz to 100KHz with sampling frequency = 500K S/s.
My sweep signal looks like this: every cycle is of 1sec which is made up of 1msec sine burst + remaining zero volts. So, in 1st second, I am sending 1ms of 1KHz burst + 0.999sec of zero volts. In 2nd second, I am sending 1ms of 2KHz burst + 0.999sec of zero volts............in 100th second, 1ms of 100KHz burst + 0.999sec of zero volts.
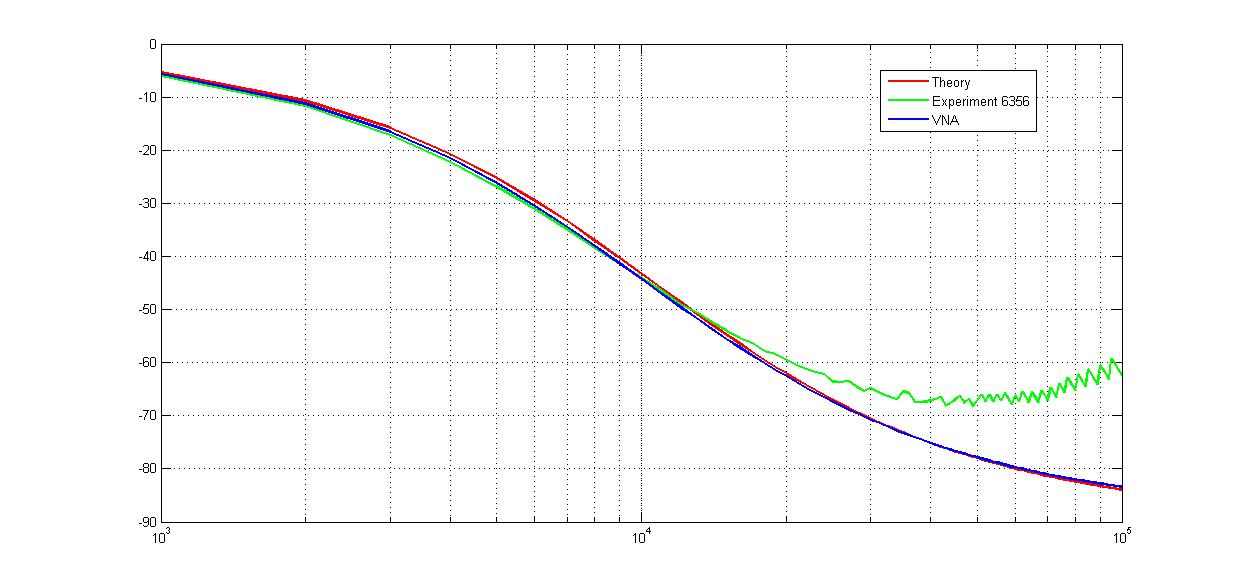
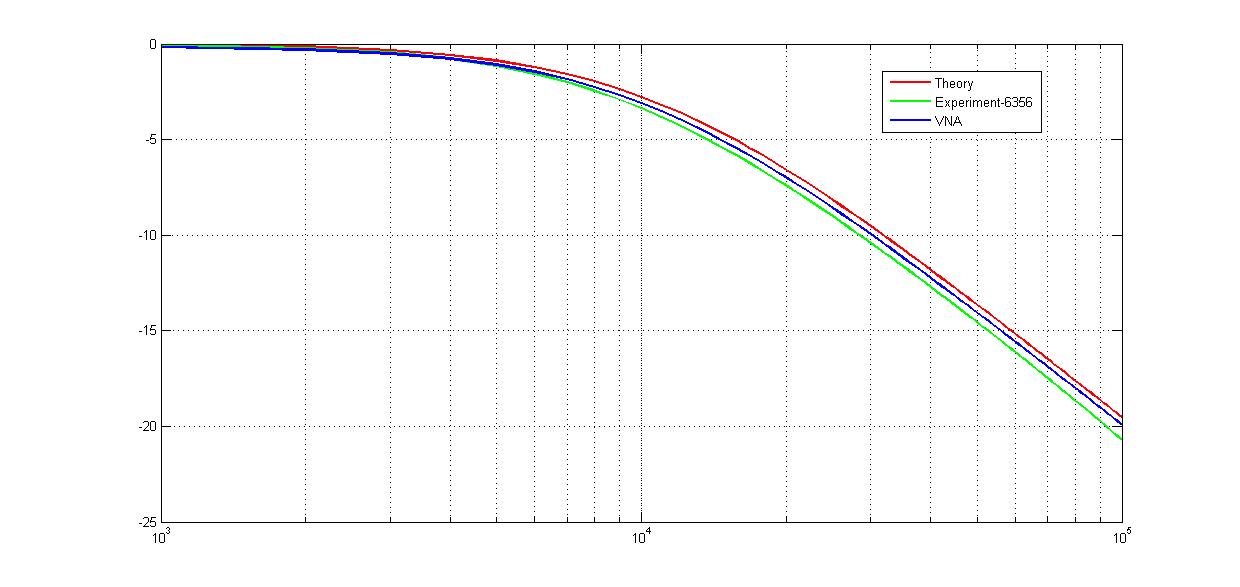
I made amplitude vs frequency graph using fft and got good result. But this is not the exact result. You can see the image attached.
I made phase vs freq plot using correlation function between RC filtered sigal and original signal. You can see the image attached. The resultant plot is quite close to the theoritical results for low frequencies but very bad as frequency increases above 50KHz.
Why this is happening?
Is correlation method good for phase calculation?

In general you want to let things settle before taking your data when doing a sweep, or you at least want to take a long enough chunk of data so that when you average over many cycles you wash out the effect of the transient.
In normal terminology, that signal is not a "sweep", it's a "pulse train" with varying pulse frequencies. It's loaded with transients and I'd not recommend it. You might save time and effort by a brute-force set of single-frequency, long-term measurements.

If I had to guess, I would say that that first cycle is affected by the discharge/charge of a coupling capacitor (something I ran into about 30 years ago). One could say that it's due to the transient portion of the circuit before it goes into its steady-state operation. And it doesn't always have to be a coupling (i.e. series) capacitor, it could be the capacitor in your filter too.


