


Complex envelope and analytic signals.
I can't get my head around the complex envelope and analytic signals. I know I have asked this before, but I considered the problem again and to me it hasn't been sufficiently answered.
A bandpass signal with frequencies f1 and f2 and a carrier frequency f_c just in the middle can be represented by:
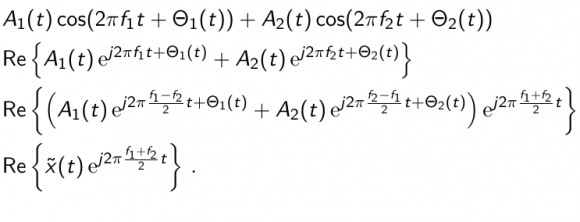
the x^~ is referred to as complex envelope of the bandpass signal. It should be possible to obtain this complex envelope through analytic signals:
x^~ = x_analytix * exp(-j*2*pi*f_c*t)
When doing so for a specific example and comparing the amplitude A and the phase Theta of the resulting complex signal to the amplitude and phase of the complex envelope, the amplitudes turn out to be equal but the phases differ. I don't understand why.
Maybe somebody can help me in small portions. That'd be great!
Here is the example, that I am referring to:
x = 0.1124*sin(2*pi*(11.5e9)*t(5)) + 0.1136*sin(2*pi*(11.95e9)*t(5));
with t(5) = 4e-12
f_c = 11.725e9
x_com = hilbert(x) * exp(-1i*2*pi*f_c*t(5))
A_com = abs(x_com)
Theta_com = angle(x_com)
Now, this is the way I would determine the amplitude and phase in Matlab, using analytic signals. To verify the results I used:
x_ver = 0.1124*exp(1i*2*pi*((11.5e9-11.95e9)/2)*t(5)) + 0.1136*exp(1i*2*pi*((11.95e9-11.5e9)/2)*t(5))
and determined its amplitude and phase.

The issue is a specific example which has not been revealed. If there were an expression of the actual example (as with Matlab code) then maybe folks could comment. I don't understand why either at this point. :-)
Well, I worked on it a bit and end up wondering about a few things:
As I read the Matlab "Hilbert" function, https://www.mathworks.com/help/signal/ref/hilbert.html,
if x=hilbert(xr) where xr is a real signal then the x is the Analytic Signal.
And the Hilbert Transform of xr is the imaginary part of x.
I don't think that's what you were expecting. It's sure not very straightforward as the terms are very specific
Also, you are doing the frequency translation and the Hilbert transform in one step - which makes it harder to check.
Here is some expanded code:
%Constants
A1=2;
A2=1;
F1=20e9;
F2=100e9;
f_c = (F1+F2)/2;
%
%Time array
for k=1:1000;
t(k)=k*4e-12/5;
end
%
%Two sinusoids and their sum
for k=1:1000;
x1(k) = A1*sin(2*pi*(F1)*t(k));
x2(k) = A2*sin(2*pi*(F2)*t(k));
x(k)=x1(k)+x2(k);
end
%
%Plot 1 x
figure
plot (x);
title ('X')
%
%Plot 2 FFT of x
xf=fft(x);
figure
plot (abs(xf));
title ('XF')
%
%Hilbert Matlab Function of x - the Analytic Signal
h=hilbert(x);
%
%Plot 3 hilbert Matlab function - Analytic Signal of x
figure
plot(abs(h));
Title ('ABS:Analytic Signal of x')
%
%Plot 4 FFT of Analytic Signal of x
HF=fft(h);
figure
plot (abs(HF));
title ('FFT of Analytic Signal of x')
%
%Hilbert Transform of x
HT=imag(h);
%
%Plot 5 Hilbert Transform of x
figure
plot (HT);
title ('Hilbert Transform of x')
%
%Plot 6 FFT of Hilbert Transform of x
HTF=fft(HT);
figure
plot (abs(HTF));
title ('FFT of Hilbert Transform of x')
%
%Compute frequency-translated Analytic Signal of x
x_com = h.* exp(-1i*2*pi*f_c.*t);
A_com = abs(x_com);
Theta_com = angle(x_com);
%
%Plot 7 X_COM
figure
plot (x_com);
title ('X/_COM')
%
%Plot 8 FFT of translated Analytic Signal of x
x_comf=fft(x_com);
figure
plot(abs(x_comf));
title ('X/_COMF')
%
%Compute x from analytic signal
%The hilbert function finds the exact analytic signal for a finite block of data
%
$Verify
%for k=1:1000;
x_ver1(k)= A1*exp(1i*2*pi*(F1/2)*t(k)) + A2*exp(1i*2*pi*(F2/2)*t(k))
x_ver(k) = h(k);
A_ver1(k) = abs(x_ver1(k));
A_ver(k)= abs(x_ver(k));
Theta_ver1(k)=angle(x_ver1(k));
Theta_ver(k)=angle(x_ver(k));
end
x_verf=fft(x_ver);
%
%Plot 8 Verify FFT of x
figure
plot (abs(x_verf));
title ('X_VERF')
I didn't exactly follow the computation you used for x_ver1 above. I suspect that's where the trouble lies. And the comparisions also didn't work for me. But it's on the right track. The frequency translated version X_COM's Fourier Transform looks right.
I changed the amplitudes and the frequencies to better visualize what was happening.

Lucky_12, in your MATLAB code did you intend to write:
f_c = 11.725e9
Our did you intend to write:
f_c = 11.75e9 (Note the '.75' versus the '.725')
It appears to me that your 't(5)' variable should be a vector of time values and not a single scalar constant.
Also, do your realize that your complex-valued 'hilbert(x)' sequence contains two positive-frequency-only spectral components? Your 'x_com' sequence will NOT be a single-frequency complex exponential sinusoid.
Unfortunately, the phases are still not equal.
t is a vector of time, but for the validation I only consider one random value t(5).
I don't understand what you mean with "Your 'x_com' sequence will NOT be a single-frequency complex exponential sinusoid."
I know that analytic signals have a positive frequency spectrum. But is this somehow related to the phase?
Hi. Somewhat unfortunately in MATLAB, using the command 'y = hilbert(x);' does NOT produce 'y' sequence that is the real-valued Hilbert transform of the real-valued sequence 'x'. Using the command 'y = hilbert(x);' produces a complex-valued analytic 'y' sequence whose real part is 'x' and whose imaginary part is the Hilbert transform of 'x'.
So in your command: 'x_com = hilbert(x) * exp(-1i*2*pi*f_c*t(5))' you are performing a matrix multiplication of two complex sequences (is that what you really want to do?). And for that command to work (without an error message) one of your complex sequences must be a row vector and the other complex sequence must be a column vector!!
My guess is that instead of the '*' matrix-multiply in your 'x_com = hilbert(x) * exp(-1i*2*pi*f_c*t(5))' command you really want a '.*' element-by-element multiply.

For a more detailed discussion, you might try


