


How to calculate time delay estimation?
TX data file: https://www.dropbox.com/s/xgyo6le3bcmd25r/RX.dat?d...
RX data file: https://www.dropbox.com/s/0nmhw6mpgh7upmv/TX.dat?d...
and easily compute the delay from this code:
<code>clear all; close all; format long;

%% initial values:
nsamps          = inf;
nstart          = 0;
Fs              = 8e6; % sample rate
flag            = 1;   % plot in the for loop
c               = 3e8; % speed of light

%% input data
file_tx         = 'TX.dat';
file_rx         = 'RX.dat';
x_tx            = readcplx(file_tx, nsamps,nstart);
x_rx            = readcplx(file_rx, nsamps,nstart);
data_time       = 10; % second % we can set time base on the length of vector x_rx
data_time       = floor((length(x_rx) - 8e5)/Fs) * 10;

factor          = data_time/10;
matric          = reshape(x_rx, [Fs/data_time*factor, data_time + 1]);
matric          = matric';
size_of         = size(matric);
len             = 1:size_of(1);
delay           = zeros(1, data_time + 1);

%% time delay calculation:
aa      = zeros(1, length(matric(1,:)) - length(x_tx));
signal1 = [x_tx aa];

for i = 1: 1%size_of(1)

    signal2                 = matric(i,:);
    [cc_correlation,lag]    = xcorr(signal1, signal2);
    [cc_maximum, cc_time]   = max(abs(cc_correlation));
    cc_estimation           = abs(length(signal1) - cc_time);
    delay(i)                = cc_estimation/Fs; % in second

    lagDiff                 = lag(cc_time);
    s2                      = signal2(abs(lagDiff)+1:end);
    t2                      = (0:length(s2)-1)/Fs;
end
%%
fprintf('\n Done! \n\n');</code>
<code>function x = readcplx(filename,nsamps,nstart); fid = fopen(filename); fseek(fid,4 * nstart,'bof'); y = fread(fid,[2,inf],'short'); fclose(fid); x = complex(y(1,:),y(2,:)); </code>
So I have matrix of delay:
delay = 0.010346125000000 0.010349000000000 0.0103498750000000.010349000000000 0.010349750000000 0.010349750000000 0.010349750000000 0.010349750000000 0.010348875000000 0.010348875000000 0.010348875000000
I want to make sure I did right or wrong?
Also, when I compute the xcorr, I see it weird from the plot, so I can not define the max of the yaxis. Do you see anything wrong?
I hope everyone can help me out?
Thank you very much.

nateduong, you wrote:
"I want to make sure I did right or wrong?"
I suggest you create your own very simple "transmit" and "receive" signal sequences and apply those test signals to your MATLAB code. Next, examine the output of your code to see if it is what you desire. If your code seems to be working, then start modifying various characteristics of your "transmit" and "receive" signal sequences to ensure that your code works for various different signals. (This kind of simple-minded testing can, however, be time consuming.)
Only after you're sure your code is working properly on simple "test" signals, should you apply "real-world" signals to your MATLAB code.

Specifically, run the transmitted data through various filters and see how well the correlation works. Some signals do better than others when you're trying to find a correlation peak of a transmit vs. a filtered receive.
@Tim Wescott:
Thank you for your suggestion, I hope you can look at my new code and give me some comment.
My new code which reply with Mr "Rick Lyons" below. You can easily find it in my topic, this code is about using Transmit signal, lagging it, adding noise for it and using it as the Receive signal.
Now I have 2 signal:
a. TX signal (original signal with no noise added)
b. RX signal which is created from TX signal with lagging and adding noise.
Then I can do xcorr using matlab to get time delay.
Did I do right?
@:
Thank you for your suggestions, I did this way, I used the "transmit"signal (without noise added), then put it in the function lagmatrix, (we can find this function from mathwork forum) and add noise. This one is used for "receive signal"
I have this code:
nsamps = inf;
nstart = 0;
Fs = 8e6; % sample rate
data_time = 10; % 10 seconds of data
flag = 1; % plot in the for loop
c = 3e8; % speed of light
file_tx = 'TX.dat';
x_tx = readcplx(file_tx, nsamps,nstart);
% plot on/off
flag_plot = 0;
% method option
if 0
n = 1:length(x_tx);
figure,
plot(n,abs(x_tx)); grid on; title('Original signal');
clear n;
end
%% input signal
l1 = length(x_tx);
b = 1;
l2 = b*l1;
singal = zeros(l2,1);
for m = 1 : b
for n = 1 : l1
signal(n+(m-1)*l1) = x_tx(n);
end
end
signal_length = length(signal); % 4001
p = 1;
for n = 1 : signal_length
if ((2.^n)<(signal_length*2))
p = p+1; % 13
end
end
assumesignallength = Fs/ data_time;
signal1 = zeros(assumesignallength, 1); % 8192x1
for n = 1:signal_length
signal1(n) = signal(n)'; % original signal(4001) with zeros(8192 - 4001)
end
% assume a time delay value;
delay = 1e5;
% generate a time delayed speech signal;
signal2 = lagmatrix(signal1,delay);
signal2(1:delay) = 0;
% generate noise signals;
noise1 = randn(signal_length,1);
for n = (signal_length + 1) : (assumesignallength)
noise1(n) = 0;
end
% generate the noisysignal by adding the speech signal and noise signal;
noisysignal1 = signal1 + noise1;
[cc_correlation,lag] = xcorr(noisysignal1, noisysignal2);
% CC method:find the peak postion of the crosscorrelation;
[cc_maximum cc_time] = max(cc_correlation);cc_estimation = abs(assumesignallength - cc_time);
delay = cc_estimation/Fs; % in second
%%%%
since I see the cc_correlation = delay = 1e5 (estimation is matched): Can I say :"I did right"?
Then I can calculate the time delay estimation using: cc_correlation divide by sample rate (Fs = 8MHz).
I hope I did right with those steps.
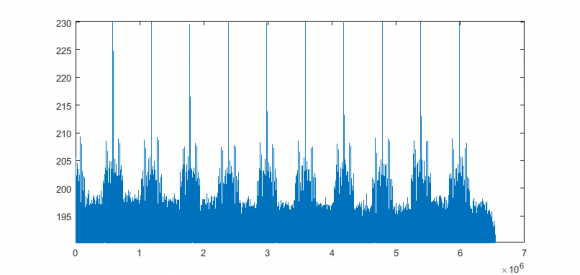
Normally cross-correlation (matched filter) is enough to get the delays:
cx = xcorr(x_rx, x_tx);
cx = cx(length(x_rx):end);
plot(db(cx)), ymax = max(db(cx)), ylim([ymax-40, ymax])
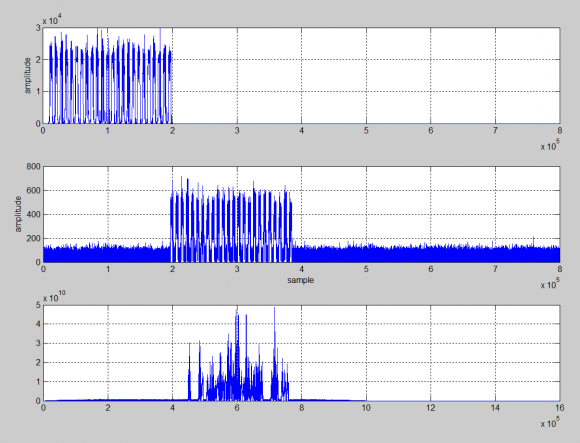
So you have some periodic signal in the receiver. But what you are doing I do not understand. What are you transmitting - looks like pulses?
@ :
- Yes, They are pulses.
- I have Transmitted data (TX.dat) which is called TX.
- I send this data to another device, then I have Received data which is called RX. This data is included TX with noise.
- In RX data, every 1 second, I receive TX data with noise, it repeats 10 seconds (periodic signal in the receiver).
- What am I doing? answer: I am trying to get time delay from every second TX send to RX. That's why I saw I cut RX data in 10 windows, and correlate with original TX data to get time delay. And I want to make sure I did not do wrong.

I was going to propose an adaptive filter so that you can run the data over and over to get a good averaged correlation.
However, I was not even able to run you code, because the following line results in 0.
Subsequent statements divide by this value.
data_time = floor((length(x_rx) - 8e5)/Fs) * 10
@ dgshaw6 :
- you can forget about this line, because I just want to set automatically recognize the time from RX data (for example: 1, 5, 10, 20 seconds data). Since I know exactly the time, I do not need this line:
data_time = floor((length(x_rx) - 8e5)/Fs) * 10
- in this case, data_time = 10;

Hi
I filtered your data to keep the bands 800-1200 and 2400-3400. Then downsampled it to 11.025kHz. The program below gives a correlation peak at 18k samples (4190x48k/11, Sorry for the hacker's style)
NFFT = 52000;
datachunkLeft = audioread('RX.WAV'); datachunkLeft = datachunkLeft(1:NFFT);
datachunkRight = audioread('TX.WAV'); datachunkRight = datachunkRight(1:NFFT);
wfft = hann(NFFT);
X = fft(wfft .* datachunkLeft); Y = fft(wfft .* datachunkRight);
XY = X .* conj(Y); PHATNORM = abs(X) .* abs(Y); XY = XY ./ PHATNORM;
MINLAG = -NFFT/4; MAXLAG = NFFT/4; maxcorr = 0;
for ilag = MINLAG: 10 : MAXLAG
Z = exp(2*pi*i*(0:NFFT-1)*ilag/NFFT);
corr = abs (sum(XY .* Z'));
if corr > maxcorr
fprintf(1, '[%d] %d \n', ilag, corr);
maxcorr = corr;
end
end
[-13000] 7.822615e+01
[-12990] 6.468112e+02
[-12630] 7.486039e+02
[-5800] 7.509771e+02
[-4540] 8.196035e+02
[4190] 1.441586e+03
>>
@laurentlefaucheur:
- I am sorry I can not run this code, because of this:
datachunkLeft = audioread('RX.WAV');
- My data file is RX.dat, but not RX.WAV and WAV format can not use for complex number.
>> datachunkLeft = audioread('TX.dat');
Error using audioread (line 88)
The file type is not supported
>> datachunkLeft = audioread('TX.WAV');
Error using audioread (line 74)
The filename specified was not found in the MATLAB path.
- could you please give me more suggestion?
- If possible, could you show me the way you did with this sentence:"I filtered your data to keep the bands 800-1200 and 2400-3400. Then downsampled it to 11.025kHz. The program below gives a correlation peak at 18k samples (4190x48k/11, Sorry for the hacker's style)"
Thank you very much.
Hi @, sorry for the confusion. I wrote the code during a bad meeting, and assuming audio and reuse of beamformer phase correlations.
Forget it. Sorry again.
@laurentlefaucheur, It's ok, at least I have more ideas, that is we can do it frequency domain.


