


Impulse behavior of FIR LP filter
 Started by 7 years ago●17 replies●latest reply 7 years ago●213 views
Hi all,
my question may sound trivial, but maybe I need a kick into the right direction, so I appreciate your ideas...
background:
A pulse (best described as a singular 1-cos pulse over 0..2piFT) is received with a sampling rate of 3 samples per pulse period and then interpolated by a factor of 8, resulting in 24 samples per period T.
Hence I need an interpolation filter (low pass with a stop band starting at 0.0625 to avoid the images).
Goal is that the interpolated signal shows the pulse with a precision of 1% or better.
problem:
I end up with a FIR filter (255 coefficients, which is quite convenient, but should not be much more).
But I lose almost 3% of the pulse amplitude (while the amplitude of the continuous cosine signal would be correct after initial phase) depending on how the 3 samples find the pulse.
I know the reason for the loss as higher frequency content (begin and end of the pulse) or leaking or dispersion. Since I can have all thinkable forms of pulse which are lower in frequency, I cannot use any approach which is specialized to solve only this case. Any training of a filter is impossible, because the pulse is not repeating.
Group delay is an issue because it's a complex pulse and phase errors must also be kept small.
I'm playing around with different FIR approaches (remez, sinc, different windowing, etc.).
question:
Any ideas if such optimization of the filter is the right way to go or if I just oversee the brilliant solution?
Any help appreciated,
Bernhard
Not sure I'm helping, but if I get your numbers right, you have a cosine burst at 0.75 of your original Nyquist frequency (3/8 of your original sample rate - three samples per cycle), then you upsample your signal by 8 and apply a low pass filter at your original Nyquist rate (1/2 of your original sample rate).
I haven't checked, but my feeling says, for a filter of 256 taps you could still see this kind of deviation (3% loss @ 3/4 of the cut-off frequency) doesn't seem strange to me.
However, I don't think you need to set your low pass cut-off to 0.0625 since aliasing images will start a lot higher at 8-times oversampling. Try 0.2 instead and check if things get better.
Another reason for the offset might be, that you still have only 24 samples per cycle and that means, you can miss the cosine peak by 1/24th cycle - you can do the math to find out if that's the reason for the deviation...
Thank you for your input.
Yes, the 3% value is what I would have expected, and as my graph shows depends on how good the peak of the pulse is hit.
I tried with different cut-off frequencies. I get worse values when changing the cut-off.
As the first graph shows it's not the problem with the 24 samples. These give at least 7.5° off the peak (which is better than 1%). But I agree that this adds to the error.
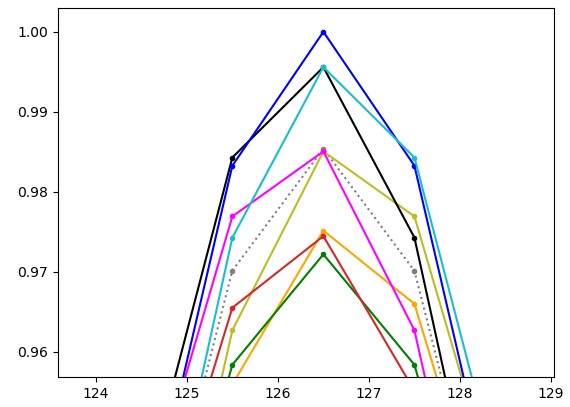
In my test setup I placed the peak exactly to one of the samples at a rate of 1/24, then picked every 8th sample. (This is mainly what happens in the target setup, too. There's a decimation because of bandwidth issues). The graph shows the result depending on which of the 8 possible starting points I choose. Here you see the 8 possibilities (grey is original rate before reduction):

The purpose of my filter is not to improve the original sampling. The interpolation filter simply shall not introduce avoidable additional errors.
Optimally, all restored curves should coincide with the grey.
My current guess is that I will end up with an overall error around 2%.

I *think* I understand what you're doing, and I'll suggest that you need more than three samples per pulse to get the accuracy you're looking for. In order to get the sort of accuracy you're looking for the pulse shape needs to be pretty consistent to your matched filter, and the more samples along the pulse the better. You probably don't need to increase the sampling rate, just more samples along the tails of the pulse. Is it possible to use more?
Using the width of the main lobe as the pulse period, Ts, it looks like you're sampling at fs = 1/Ts or pretty close to it. With the same sample rate if you increase the length of the filter from 3T to NT where N > 3, you will probably see performance increase with N with some diminishing returns as N continues to increase. Pick your N for adequate performance. In comm systems N is usually not less than 8 if high performance is desired.
Thanks for your estimation.

Looking at that graph, it looks like the filter is doing exactly the right thing. If you analyze the signal WRT to energy vs. frequency then the the time offset should make no difference. You just want enough points that the peak variation is below some arbitrary level.
If I get time, I could look at one possibility. Fred Harris has a number of papers on a recursive linear phase, polyphase filter. I think it can be used as an interpolator at much lower cost than a FIR filter.
Sounds interesting.
I guess that all you guys are right, it's a big challenge, very close to the physical limits. So the only real chance is to find that approach which is best suited. But it will probably bring only a little improvement as startibartfast stated.
It is a multichannel arrangement, meaning that even little improvement or performance gain might be important in terms of ressources.
Increasing the sample rate would be the last resort because it degrades the device's usability.
For the moment, thanks to you all for your valuable feedback!
Great group!

Hi Bernhard. Are you able to post an image here of the time-domain samples contained in your input "pulse"?
Rick, how does one attach a figure to the reply?

Hello Fred, as simple as 'drag and dropping' the image in the editor. Alternatively, if you click on the image icon at the top of the editor,you should be showed a dialog box allowing you to choose a file. Let me know if that doesn't work for you and thank you for your participation to this forum

Hi Fred,
you got it. In the first row of your img the first sine shows a lower amplitude than the following. If only one sine pulse would be there, it's obviously one with a lower amplitude.
I could explain that as you did (starting transient of interpolator) or with many other ways, e.g. the pulse will load every storage place in the filter meaning that there's not one single step when the original pulse will come out of the filter again (this wouldn't be a filter at all). It's all quite trivial.
So my question aims to that:
if I can achieve an an error of only 3% so easily, is there a real chance to bring this error down to 1% (meaning the error resulting from decimation+interpolation) and regarding only the peak value.
I guess this will not work with usual FIR filters, because I cannot reduce losses so much.
You can eliminate, or reduce to any desired level, the overshoot in the ring-up transient by reducing the size of the impulse response side lobes... one way to do this a is use a window such as the Kaiser that has no side lobes... but then filter spectrum will be compromised (no flat region... (parabolic on a log scale). better to have low level sidelobes in impulse response......
another option is to up sample by a larger amount and then down sample to the desired sample rate with transient envelope ripple controlled by selecting the best sample set to be preserved in the down-sampling process... equivalent to interpolation to desired sample rate with a bank of polyphase filters... each filter contributing successively more time delay.... in comms.. we do this for timing recovery...
fred
OK. I agree, that I could have given more detailed information about the signal flow around the filter...
more background
It's a measurement signal coming from ADC. The sampling positions therefore are asynchronous with respect to the pulse, meaning we may or may not hit the peak of the signal. The minimal width of the pulse is expected to be so that we have 24 samples on the whole pulse.
The frequency content of the pulse should not be more than Fs/24.
For transmission purposes it's reduced by a factor of 8.
After transmission I want to restore the original pulse at original sample rate (interpolation by 8).
Main issue is getting the peak of the pulse with best accuracy.
Since we have a vector signal (x and y components), for the interpolation filter either complex filtering should apply or the filtering should have linear phase, because otherwise we get phase issues between x and y.
idealisation
For simulation/demonstration purposes I created the following pulse:
t0=zeros(1,10);
t1=0:24;
x1=1/2*(1-cos(t1/24*2*%pi));
x0=zeros(t0);
t2=[t0 t1 t0];
t=0:length(t2)-1;
x=[x0 x1 x0];
Now when sample rate reduction takes place, an arbitrary starting point is selected and from there every eigth's sample is taken as reduced stream.
These (red crossed) points are the source stream for the filter.

When I tried to insert the above figure (drag and drop) it was there until I pressed "submit". After that it was not visible any more.
I tried that again, it failed again.
I was only successful, when I added it using the img icon above.
Although I could import the code snippet by drag and drop.
Strange ...

For a more complete picture of the problem and its solution, state your coefficient resolution. If that is too small, then the 1% target error may be eaten by quantization alone. I'm guessing most here "assume" single-precision floating point, but if this is done on a 8-bit AVR..? Also, there has been no discussion of SNR. This should include an analysis of clock differences between generation and sampling. With that, should also be an analysis of what the timing differences are between the two better determine how those 3 samples of the signal are distributed along the acquired sine wave.
This problem could be reinterpreted as simply a detection issue, so let me propose alternate approach: correlation of the measured target with the ideal target. This could then use maximum likelihood to find the best match for the current sample (like most modern magnetic hard drives do to decode "bits"). This may not use the same type of "hammer" available in typical DSP, but it may provide a more optimal solution.
Coefficient resolution should not be a problem (filtering will be done in OpenCV on graphics card of a PC board, so tends to be 32 bits FP or better).
Transmission is only 2x8bits (x,y), so here's a limiting factor. The filter might even help here.
Distribution of the 3 samples is always (let's say) perfect downsampling from equidistant samples at the original signal with 24 samples per pulse and frequency at Fs/24. So after downsampling the pulse "frequency" is Fs/3.
I guess that timing is not an issue therefore.
But what I cannot control is which of the eight possibilities to downsample by a factor of 8 is applied, since the pulse is asynchronous to the sampling.
Earlier we tried to "adjust" the pulse so that the sample with the maximum will be in the downsampled stream, but we cannot afford the phase step which happens during adjust because the incoming signal isn't always this pulse but can be any arbitrary signal of lower frequency.
Therefore the purpose of this investigation is to make sure that we can live without this adjustment and will find the maximum to be restored accurately enough.
Hi, all,
I think the 3% amplitude ripple is simply the starting transient of the 1-to-8 interpolator. If we have a random phase between cosine and sampling process and repeat the sampling and interpolation you will see the starting transient effect on the end samples. If you have a short sequence, the transient will not be able to die off for the steady state response. Had I known how to attach figures I would have and you could clearly see the transients.
copy and run attached code
x0=cos(2*pi*(0:59)*3/8+2*pi*rand(1));
x8=zeros(1,480);
x8(1:8:480)=x0;
h=sinc(-10:1/8:10).*kaiser(161,8)';
y8=conv(x8,h);
figure(1)
subplot(3,1,1)
plot(0:639,y8,'linewidth',2)
hold on
stem((0:479)+80,x8,'r','linewidth',2)
hold off; grid on
axis([0 640 -1.2 1.2])
title('1-to-8 Interpolated sinewave, 3-samples per cycle, Random Phase')
subplot(3,1,2)
plot(0:639,y8,'linewidth',2)
hold on
stem((0:479)+80,x8,'r','linewidth',2)
hold off;grid on
axis([0 640 0.95 1.05])
title('1-to-8 Interpolated sinewave, Zoom to Peak Amplitudes')
subplot(3,1,3)
plot((-0.5:1/4000:0.5-1/4000)*8,fftshift(abs(fft(x8,4000)/32)),'linewidth',2)
hold on
plot((-0.5:1/1000:0.5-1/1000)*8,fftshift(abs(fft(h/8,1000))),'r','linewidth',2)
hold off;grid on
axis([-4 4 0 1.1])


